Abstract
Keywords: Silicone polymer; flexible strain gauge; underground coal mining; physical model experiment; fracture-bridging capability; full-process monitoring; overlying strata; slope instability
As an important component of China’s primary energe [1,2], the large-scale extraction of coal often triggers geological disasters such as surface subsidence and landslides [3]. Especially in mining areas in the western and northern mountainous and hilly regions of China, underground coal mining creates extensive goaf areas, which can lead to the movement of overlying strata and redistribution of stress, seriously affecting the stability of overlying strata and slope within the area and even causing catastrophic landslides, posing a serious threat to the safety and ecological environment of the mining areas and its surrounding regions [4]. For example, in 2009, a large-scale rock landslide-debris flow event was triggered by underground coal mining at Jiweishan in Wulong, Chongqing, China. The landslide body was 60 m thick, 1500 m long, and had a volume of about 7 million cubic meters. The iron mine was destroyed, resulting in 74 deaths, with significant economic loss and casualties [5]. In 2017, the overlying strata deformation induced by underground coal mining in Pusa Village, Nayong County, Guizhou Province, China, led to cracking on the slope top and rock mass toppling and destruction. About 823,000 cubic meters of rock and soil collapsed, causing significant casualties [6]. It can be seen that underground coal mining induces instability of the overlying strata and slope, which has become an unavoidable geological disaster, seriously affecting the safety of people’s lives and property on the surface as well as underground mining safety. Therefore, in-depth research on the impact of underground coal mining on the stability of overlying strata and slope is of great significance for ensuring mining area safety and promoting sustainable development.
Regarding the study of underground coal mining-induced instability of overlying strata and slope, scholars both domestically and internationally have conducted extensive research on the response mechanisms of overlying strata and slope affected by mining through physical experiments, numerical simulations, theoretical analysis, and field monitoring. Lu et al. [7] studied the deformation, failure, and evolution of mining-induced landslides using field surveys and theoretical analysis, and developed a mechanical model of the overburden structure, from which they derived the criteria for key-block sliding instability and rotational deformation instability. Lv et al. [8] analyzed the deformation of rock strata and the mechanisms of slope instability during mining through three-dimensional optical displacement monitoring and numerical simulation. Deng et al. [9] conducted physical similarity simulation experiments and established a comprehensive monitoring system that incorporated mining-induced stress, displacement, temperature, and acoustic emission, thereby investigating the interrelations and evolutionary characteristics of multiple mechanical parameters during overburden rock caving in longwall panel mining. Li et al. [10] studied the macroscopic response characteristics of the surrounding rock and overlying strata during open-pit underground mining through similar material experiments and numerical simulations. Wang et al. [11] studied the failure features of overburden strata and surface crack evolution in shallow coal seam group mining using theoretical analysis, numerical modelling, and in-situ monitoring, which offers a reference for mitigating surface subsidence. Huo et al. [12] revealed through physical model experiments that the movement of overlying strata under roof cutting and pressure relief can be divided into four stages: fracture zone expansion, caving zone development, rapid caving, and stabilization. Nizametdinov et al. [13] identified potential collapse hazard zones through laboratory experiments and proposed recommendations for optimizing slope parameters and mining techniques. Sun et al. [14] effectively predicted the movement of overlying strata and surface subsidence during shallow coal seam mining by using the AFM and AHM models, combined with numerical simulations and field measurements. Bian et al. [15] investigated the movement and damage characteristics of overburden structures in deep thick coal seam mining through physical similarity simulation experiments and numerical simulation. Liu et al. [16] studied the characteristics of overlying strata damage caused by shallow buried coal seam mining in valley areas through field investigation and numerical simulation. Liu et al. [17] verified the asymmetric quasi-hyperbolic movement model of the overlying strata during coal seam mining under thick loose layers through similar material experiments and numerical simulations, effectively predicting the overlying rock movement patterns. Wang et al. [18] analyzed the deformation, stress, and evolution of plastic zones in the overlying strata during the mining process through field investigations and numerical simulations. Lu et al. [19] established a large-scale 3D physical similarity model and adopted innovative mining simulation methods to investigate the stress evolution, deformation features and fracture field distribution laws of roof and floor strata induced by underground coal mining. Physical model experiments, as an important means of studying the deformation and failure of rock and soil masses, have irreplaceable advantages in revealing the response patterns of strata and slope above mining areas [20].
Nevertheless, in physical model experiments using sand-lime-gypsum-based brittle similar materials with low tensile strength, traditional strain gauges suffer from stiffness mismatch between their rigid substrates and the brittle similar materials. This mismatch induces a local constraint effect at monitoring points, causes signal interruption upon fracture penetration, and makes it difficult to achieve continuous monitoring throughout the entire deformation and failure process. To overcome the shortcomings of traditional strain gauges in material monitoring, researchers have developed various improved strain monitoring technologies. In the field of structural health monitoring, Yoon et al. [21] proposed a structural health monitoring method based on deep neural networks and principal component analysis, which enables real-time prediction of full-field strain distribution in composite plates via strain gauges and accurate identification of crack location and length. Shah Mansouri et al. [22] developed a strain gauge sensor network based on Bluetooth low energy, realizing remote crack monitoring of composite structures. Boursier Niutta et al. [23] systematically compared the performance of polyimide-coated optical fibers, acrylate-coated optical fibers, strain gauges of different sizes, and digital image correlation technology in strain measurement of woven composites, and found that sensor size, coating rigidity, and installation method exert significant influences on the response to strain field heterogeneity. Regarding environmental impacts and long-term monitoring, Racek et al. [24] systematically investigated the effect of temperature on the output signals of resistance strain gauges bonded to rock surfaces. Jin et al. [25] addressed the demand for long-term stress monitoring in slope engineering: they improved the CSIRO hollow inclusion method, proposed a dual temperature compensation technique, and developed an acquisition system with power-off data storage function and a cloud-based monitoring platform, achieving long-term stable monitoring of induced strain under environments with large temperature fluctuations. Zhao et al. [26] adopted resistance strain gauges and fiber Bragg grating strain gauges for flight load calibration of aircraft composite wings, and verified the effectiveness of the method through ground calibration experiments and flight tests, realizing real-time measurement of flight loads. Yan et al. [27] employed a soft elastic capacitive flexible strain sensing skin to monitor crack initiation and propagation in concrete structures through capacitance variations, achieving low-cost, large-area strain distribution measurement. Although the aforementioned strain monitoring technologies have yielded favorable application outcomes in their respective fields, they still present obvious limitations in geotechnical engineering physical model experiments. Most strain monitoring technologies are designed for metal or composite structures and cannot be directly applied to deformation monitoring of brittle similar materials. The local constraint strengthening effect of traditional rigid strain gauges is particularly prominent in brittle similar materials, and further breakthroughs are required to ensure signal continuity during fracture propagation and penetration.
This study introduces a flexible strain gauge encapsulated with low-modulus, high-elongation silicone polymer, and investigates its feasibility in improving rigid-flexible interface compatibility and enhancing signal continuity during fracture development, aiming to overcome the limitations of traditional rigid strain gauges in deformation monitoring of brittle similar material physical model experiments. By conducting physical model experiments on the instability of overlying strata and slope induced by underground coal mining, with the Shanbula mining area as the engineering background, the real slope dimensions and materials of the gully-developed mining area in Shanbula are proportionally adjusted. The silicone polymer flexible strain gauges are embedded during the layered laying process of the model To monitor the internal strain and surface failure processes of the overlying strata and slope during excavation. and to study the evolution laws of rock mass strain, fractures, and failure characteristics during underground mining. This work verifies the sensing performance of the proposed strain gauge in whole-process strain monitoring for physical model experiments of brittle similar materials, in order to enrich the theoretical research results on the causes of overlying strata and slope instability induced by underground coal mining, and provide a reference for the promotion and application of silicone polymer-based flexible sensing materials in geotechnical experimental research.
2. Purpose and principle of the experiment
This study aims to introduce a flexible strain gauge encapsulated with low-modulus, high-elongation silicone polymer and verify its sensing performance in physical models constructed from sand-lime-gypsum-type brittle similar materials. Taking underground coal mining on overlying strata and slope instability as the validation scenario, physical model is established to monitor internal strain and surface failure processes during excavation. The strain evolution of rock mass strain, fracture development, and deformation failure characteristics are further analyzed, and the performance of the proposed strain gauge is evaluated in terms of rigid-flexible interface compatibility and fracture-bridging capability. This work provides a reliable sensing scheme for whole-process deformation monitoring of physical model experiments of brittle similar materials.
2.2. Principle of model similarity
When conducting geotechnical engineering similarity simulation experiments, in order to ensure that the model can accurately reflect the mechanical behavior of the prototype, according to the principle of similarity, both the model and the prototype must satisfy geometric, physical, equilibrium, stress boundary conditions, and displacement boundary conditions [28,29]. That is, when the similarity relationship satisfies the following Formula (1).
(1)
In Eq. (1): C is the similarity constant, P and M represent the prototype and the model, respectively, l is the geometric dimension, t is time, σ is stress, γ is unit weight, μ is Poisson’s ratio, and e is the modulus of elasticity.
When conducting physical model experiments, it is extremely difficult to ensure that all similarity conditions are met. In view of the limitations of actual experimental conditions and the feasibility of experimental operations, this experiment selects the main similarity criteria: , , . Other similarity conditions are considered in accordance with practical situations. In the experiment, each excavation step of 10 cm corresponds to approximately 10 m in the prototype, and the 5 min standing time after each excavation corresponds to approximately 50 min in the prototype. The primary objective is to capture the internal strain of overburden strata and slopes as well as the surface failure process under the progressive expansion of the goaf. Accordingly, the 5-min standing time is determined mainly based on the principle of deformation stabilization, and is adopted as the uniform dwell time for quasi-static stepwise excavation. Specifically, the rock mass is deemed to have completed stress redistribution when the strain change rate at key monitoring points remains below 5 × 10⁻⁶ per minute for 3 consecutive minutes. Therefore, the time similarity ratio is intended to ensure the similarity between the model and the prototype in terms of the time scale of stress adjustment, rather than strictly reproducing the advancing speed of the on-site coal mining face.
3. Physical model experiment design
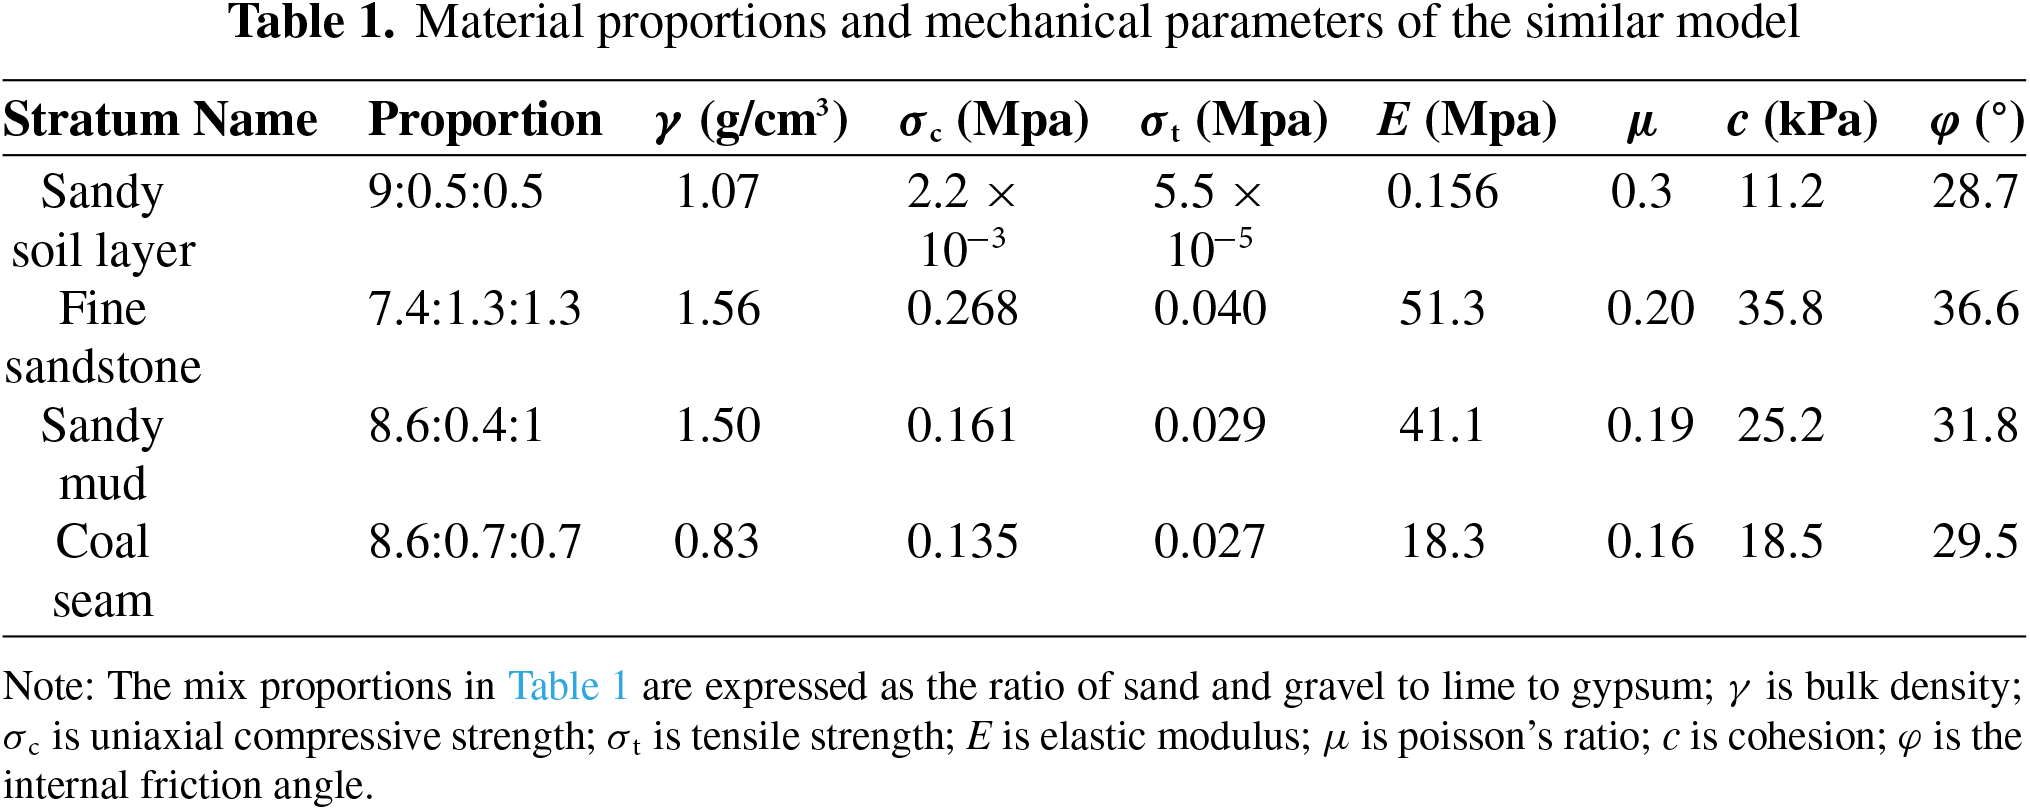
The experiment is based on the engineering background of Shanbula Coal Mine. The model laying material is an artificially remolded soil sample mixed according to a certain ratio of sand and gravel, lime, gypsum, and a small amount of coal powder, laid in layers and compacted. Progressive excavation is carried out for the two coal seams, which are 3.7 m apart. To satisfy the requirements of the geometric similarity ratio and stress similarity ratio , proportioning experiments of similar materials were conducted for each stratum prior to formal model construction. The final proportioning schemes of similar materials for each stratum and the Physical and mechanical parameters measured from standard specimens are detailed in Table 1.
3.1.2. Preparation of silicone polymer flexible strain gauges
The brittle similar physical model composed of sand, lime and gypsum adopted in this experiment features low tensile strength and the high susceptibility of its surface to local constraint induced by traditional rigid strain gauges (as shown in Figure 1a). Accordingly, this study develops a flexible strain gauge encapsulated by low-modulus, high-elongation silicone polymer (as shown in Figure 1b). During fabrication, a low-modulus silicone polymer is used as the adhesive substrate, on which metal foil strain gauges (model: BF120-3BA, substrate size: 10 mm × 10 mm) are bonded and fixed. Primary curing is then performed for 24 h under conditions of (25 ± 2)°C room temperature and (50 ± 5)% relative humidity. Finally, the same silicone polymer is coated as the outer flexible encapsulation layer with its thickness controlled at 0.05 mm–0.1 mm (Figure 1c), and secondary curing is conducted for 48 h under the same temperature and humidity conditions, yielding an integrated silicone polymer flexible strain gauge with a “sandwich” structure.
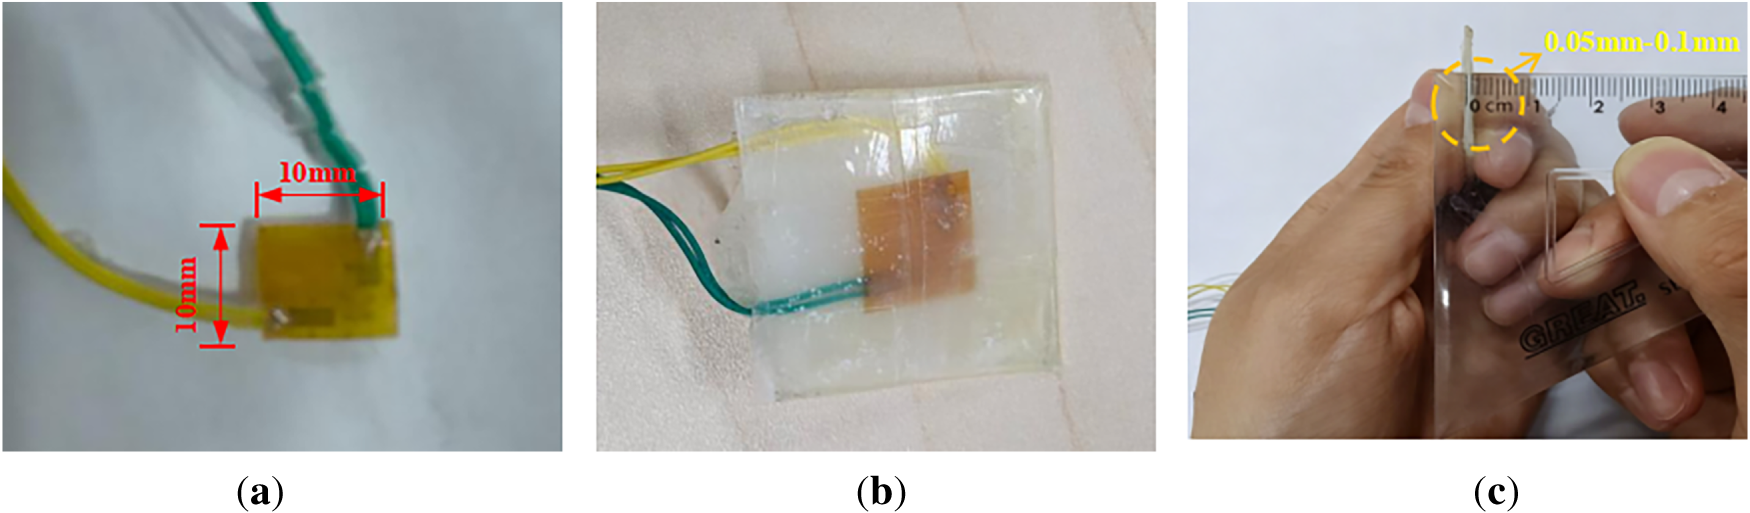
Figure 1. Strain gauge; (a) Traditional strain gauges; (b) Silicone polymer flexible strain gauge (c) Thickness of silicone polymer encapsulation layer
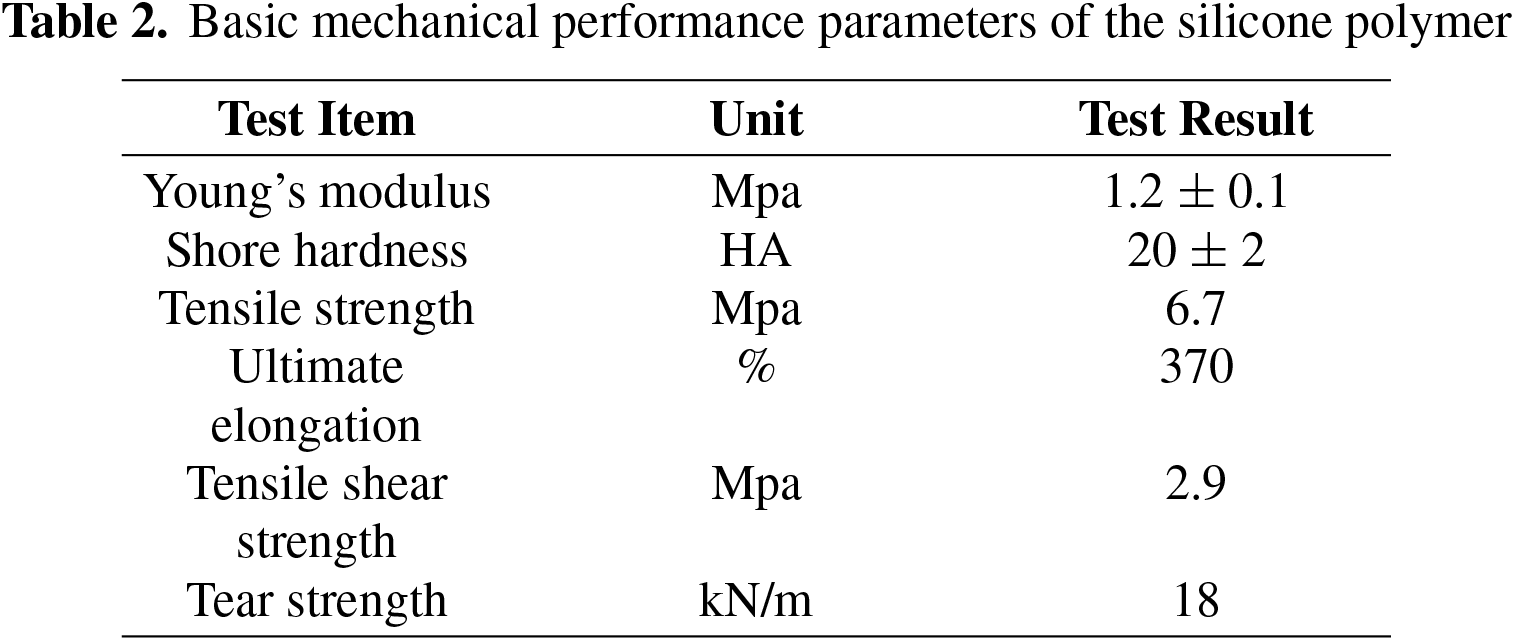
The basic mechanical performance parameters of the silicone polymer used in this test are listed in Table 2. In terms of material mechanical properties, the silicone polymer features a low-modulus characteristic with a Young’s modulus of approximately 1.2 ± 0.1 MPa. For the main brittle strata in the model (fine sandstone, sandy mudstone and coal seam, with elastic moduli ranging from 18.3 MPa to 51.3 MPa), the modulus of the silicone polymer is far lower, which effectively alleviates the local constraint effect of traditional rigid strain gauge substrates on brittle rock masses. For the sandy soil layer of the slope (with an elastic modulus of 0.156 MPa), although the modulus of silicone is higher, its high ductility and flexible interface still provide significantly better deformation compatibility than conventional rigid strain gauge substrates, without causing obvious local constraint strengthening. With a tear strength of 18 kN/m and an ultimate elongation of 370%, the polymer can undergo coordinated deformation synchronously with the model. It realizes fracture bridging through the stretching and slippage of molecular chains during fracture propagation and penetration, thus continuously outputting reliable strain signals. The upper model material is then laid and compacted, forming a sound three-dimensionally wrapped mechanical bond between the strain gauges and the surrounding brittle model material, which further guarantees the accuracy of strain transfer. To further enhance the interfacial bonding strength, a thin layer of cement mortar with a thickness of approximately 0.2 mm is uniformly coated on the surface of the strain gauges prior to embedding. Combined with the inherent tensile shear strength of 2.9 MPa of the silicone polymer, this treatment effectively mitigates interfacial micro-slip in high-shear zones.
The experiment was conducted on a model testing machine with a length of 1.4 m, a width of 0.4 m, and a height of 1.2 m (as shown in Figure 2a). An experimental model with geometric dimensions of 1.2 m in length, 0.2 m in width, and 0.68 m in height was constructed (as shown in Figure 2b). Vertical displacement at the bottom of the model was constrained by the base plate of the test rig, and horizontal displacements on the left and right sides were restricted by rigid baffles. The top of the model served as a free surface with no vertical constraint applied. The front and rear faces of the model were treated under the plane strain condition, with out-of-plane displacements constrained. Coal pillars with a width of 10 cm were reserved at both ends of the model to eliminate boundary effects. Strain gauges were laid inside the model, the surface was coated with a white layer, and a 10 cm × 10 cm square grid was arranged. Points corresponding to the strain gauges were marked on the grid to facilitate intuitive observation of the experimental phenomena and results. The model structure is shown in Figure 3.
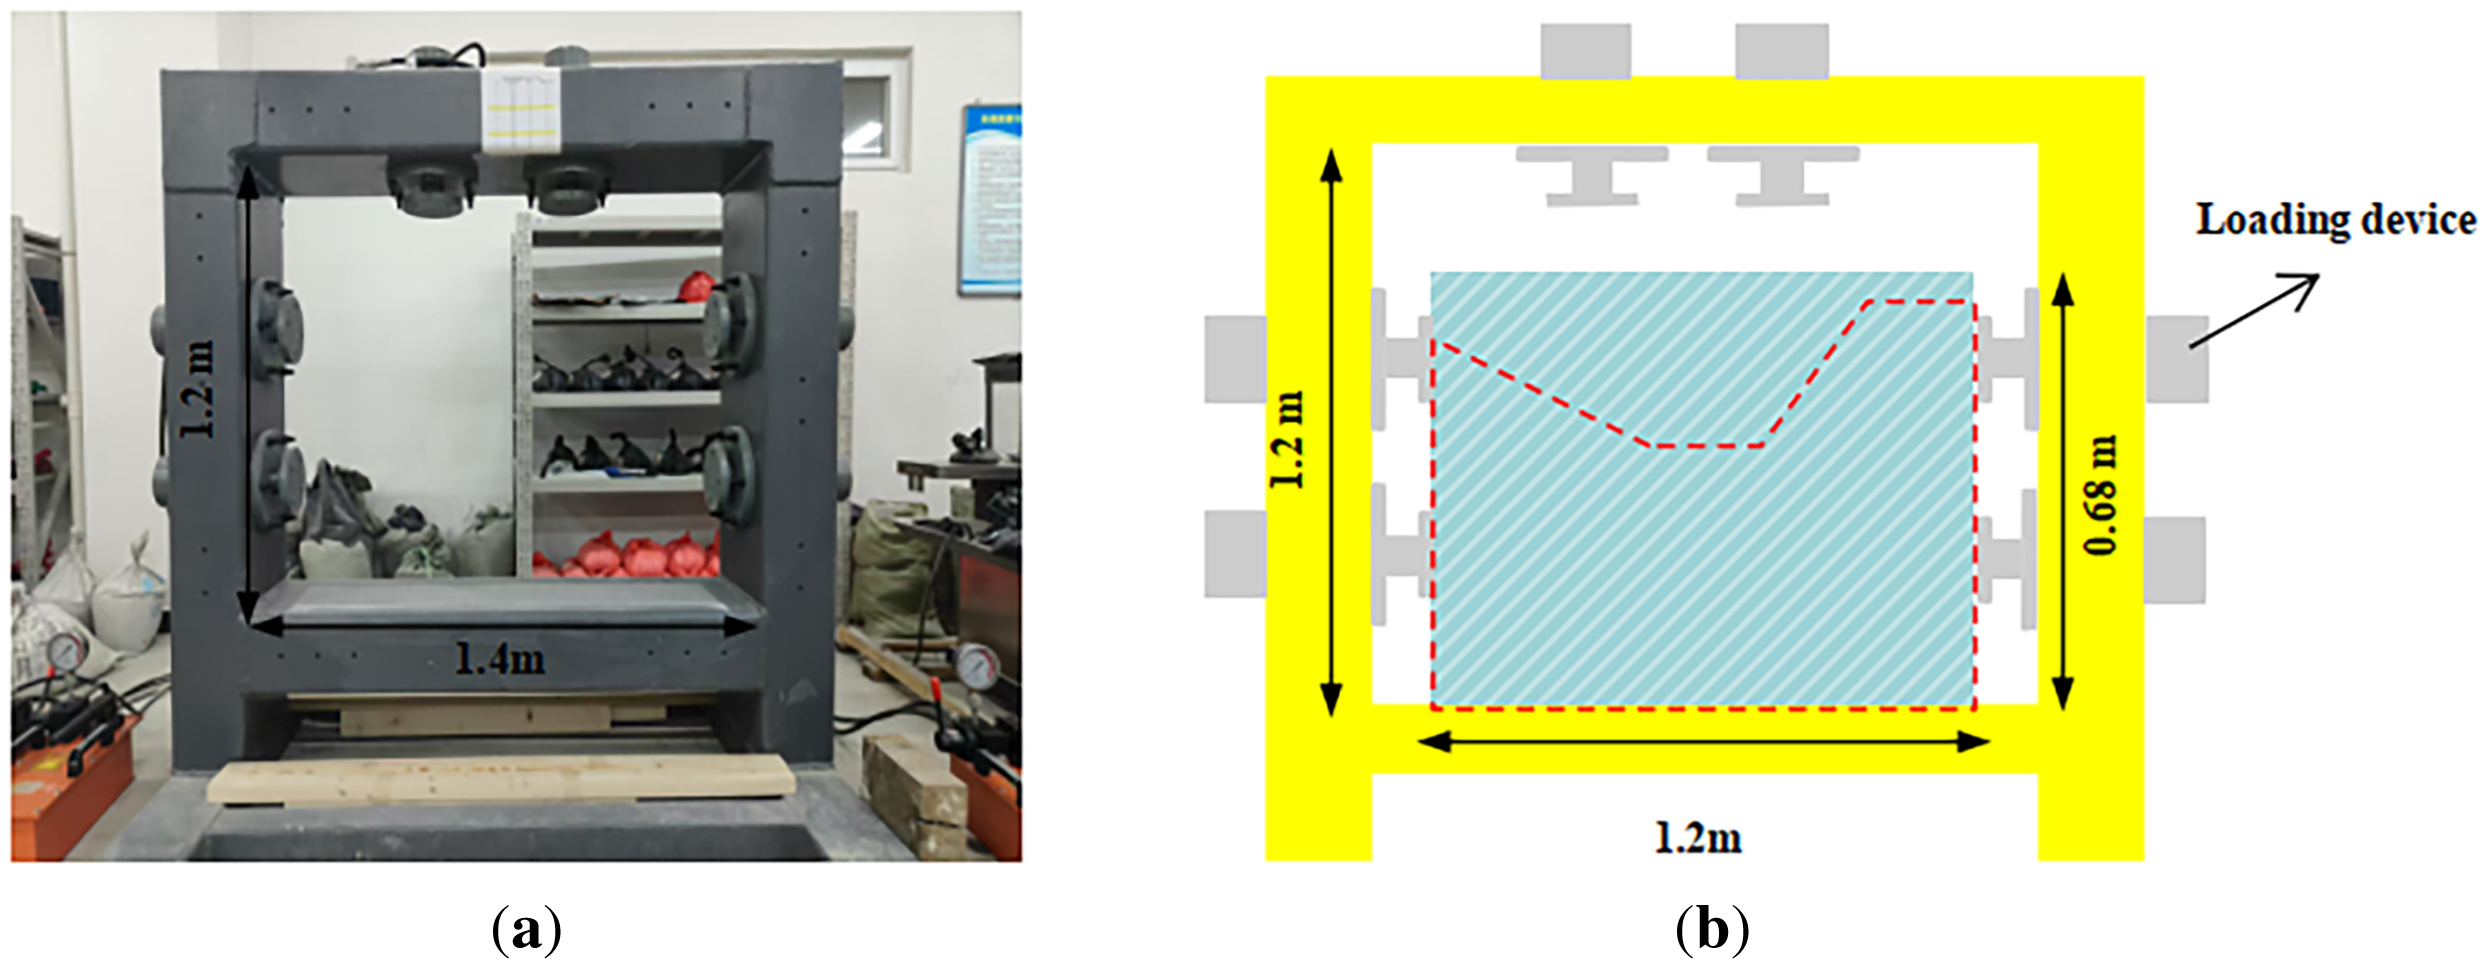
Figure 2. Model structure: (a) Model testing machine; (b) Model constrction diagram
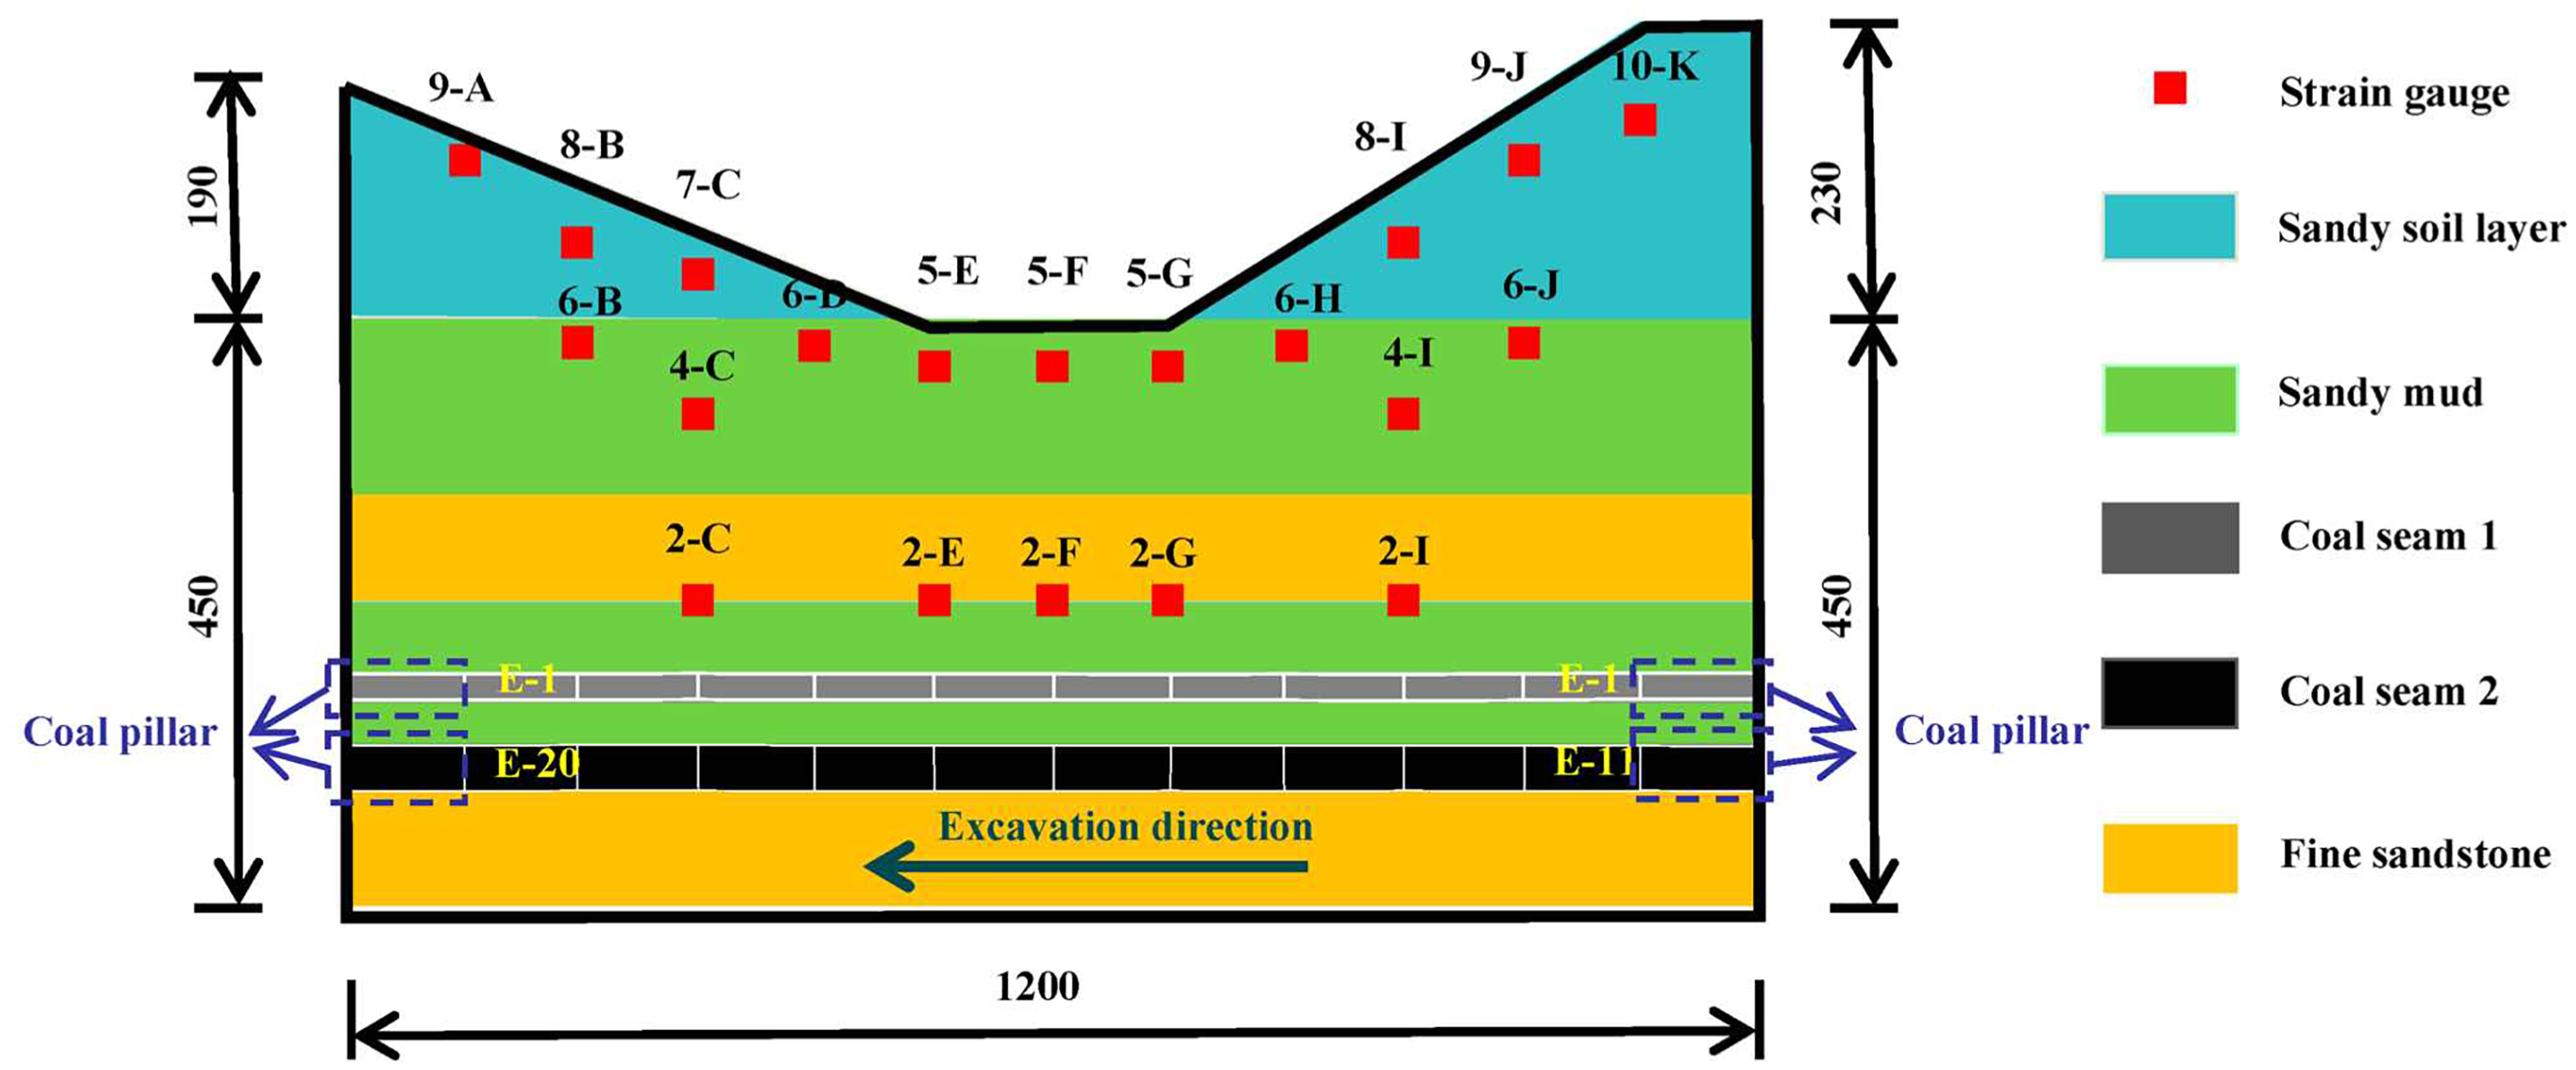
Figure 3. Model experiment scheme
The underground shallow coal seam mining process is simulated through progressive excavation. The excavation step length of the model is 10 cm, which corresponds to approximately 10 m in the prototype when converted by the geometric similarity ratio. After each excavation, the model is left to stand for 5 min, corresponding to roughly 50 min in the prototype according to the time similarity ratio. The 5-min standing time is determined mainly based on the principle of deformation stabilization, and is adopted as the uniform dwell time for quasi-static stepwise excavation to ensure the similarity between the model and the prototype in terms of the time scale of stress adjustment. Strain and surface deformation are continuously recorded throughout the process.
Using static strain indicator, 20 strain measurement points are arranged at key locations inside the overlying strata and slope to analyze the evolution of strain and failure characteristics of the overlying strata and slope during underground mining. All monitoring points employ the aforementioned silicone polymer flexible strain gauges, with a data acquisition frequency of 0.333 Hz and a quarter-bridge wiring configuration. In the initial deformation stage of the model, the flexible encapsulation layer mitigates the local constraint effect induced by the rigidity of conventional strain gauges on brittle similar materials. In the fracture propagation stage, the flexible encapsulation layer demonstrates crack bridging capability and maintains signal continuity at crack positions. In the stage of severe overburden movement, the viscoelastic property of the polymer exerts a buffering effect, ensuring complete acquisition of dynamic signals. During test setup, the prefabricated silicone strain gauges are embedded at the predetermined monitoring points in the model.
The experiment simulates the process of underground coal mining through progressive excavation. Two coal seams are set up, and excavation is carried out progressively from right to left on each coal seam. Considering boundary effects, 10 cm coal pillars are reserved at both ends of the model. The two coal seams are excavated 10 times each from right to left, for a total of 20 excavations, with a retreat length of 1 m for each excavation in each seam. The upper seam is Coal Seam 1, and the lower seam is Coal Seam 2, as shown in Figure 3.
The experiment used static strain gauges to monitor the strain of the overlying strata and the slope interior. Twenty strain measurement points were arranged at key locations within the overlying strata and the slope interior, divided into three groups: the overlying strata and slope on the right side area (2-I, 4-I, 6-H, 6-J, 8-I, 9-J, 10-K), the overlying strata in the middle area (2-E, 2-F, 2-G, 5-E, 5-F, 5-G), and the overlying strata and slope on the left side area (2-C, 4-C, 6-B, 6-D, 9-A, 8-B, 7-C). During the progressive excavation process, the strain values at various measuring points are continuously recorded to analyze the strain evolution patterns in the overlying strata and the interior of the slope. The strain gauge arrangement plan and connection method are shown in Figures 3 and 4. Compared with traditional rigid bonded strain gauges, the silicone polymer flexible strain gauges adopted in this experiment can maintain structural integrity after macroscopic fractures appear on the model surface. Relying on the fracture bridging capability of their high-toughness encapsulation layers, they continuously output strain signals correlated with fracture evolution.
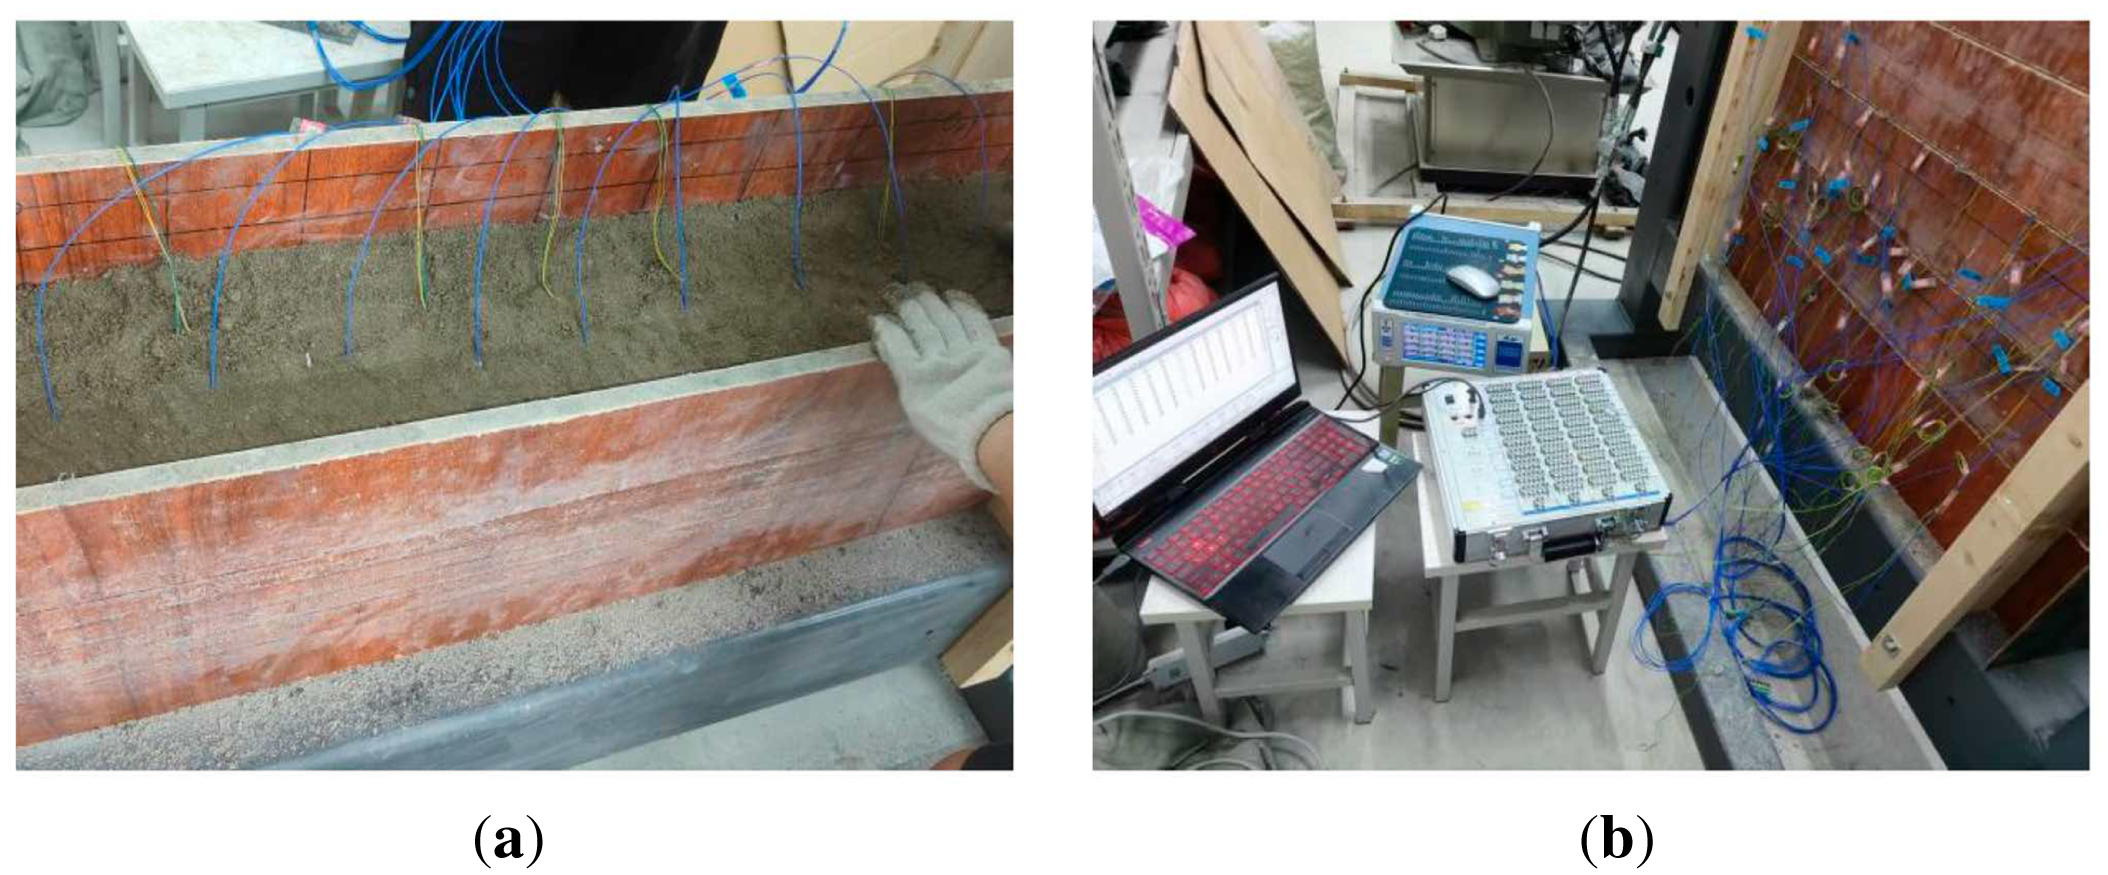
Figure 4. Strain gauge connection; (a) Strain gauge embedding; (b) Strain gauge preparation
3.3.2. Surface damage monitoring
In order to observe the surface damage characteristics of the the overlying strata and the interior of the slope during the mining process, the model surface was coated with a white layer and a 10 cm × 10 cm square grid was arranged, with strain gauges placed at the grid intersections corresponding to the measurement points. Using the lower left corner of the model as a fixed reference point, a high-definition camera is used to dynamically monitor the entire surface of the model (as shown in Figure 5). The camera was arranged perpendicular to the model to ensure that the entire model was captured in the frame, and the camera position was kept fixed during the experiment. During the period when excavation is paused after each stage, images of the overlying strata and slope surfaces were continuously captured to monitor the deformation of the overlying strata and the interior of the slope under excavation conditions.
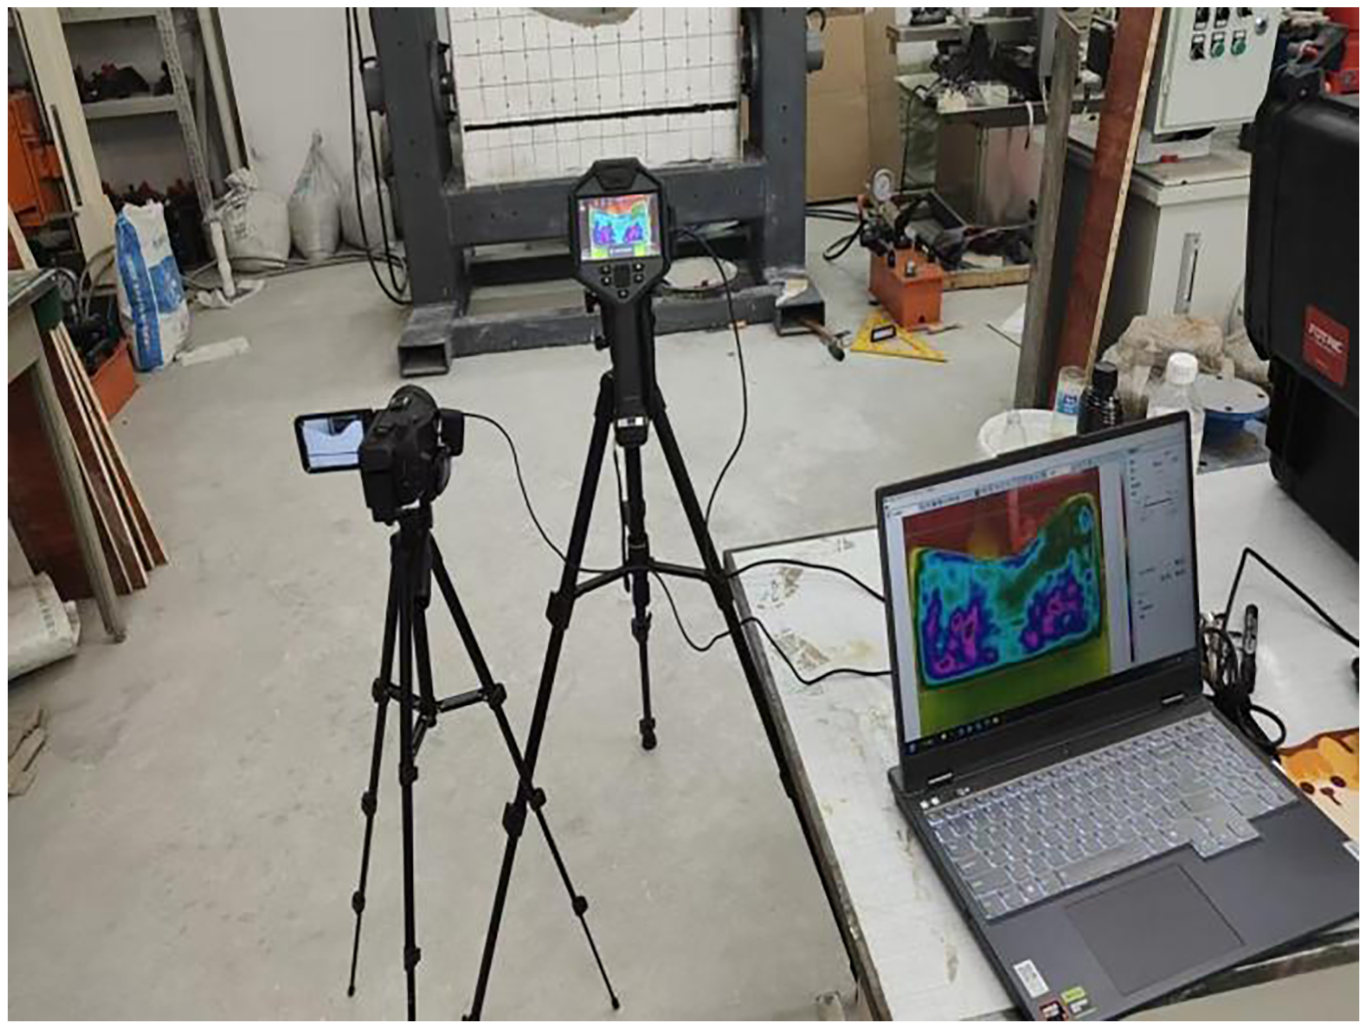
Figure 5. Surface damage monitoring
4. Analysis of experimental results
4.1. Deformation and failure characteristics of overlying strata and slope surfaces
By simulating the underground coal seam mining process through progressive excavation, the overlying strata and slope exhibit obvious staged deformation and failure characteristics under the influence of mining activities. As the number of excavation steps increases, the internal stress state of the overlying strata and slope undergoes significant changes, leading to adjustments in the rock mass structure, eventually forming different types of fractures on the surface, accompanied by multiple overlying strata collapses.
When Coal Seam 1 was excavated 1 to 3 times, no obvious fractures were observed on the overlying strata and the slope surface. When Coal Seam 1 was excavated for the third time, with a cumulative excavation step length of 30 cm, the overlying strata experienced its first collapse (as shown in Figure 6a). The initial fracture of the immediate roof indicates that the overlying strata are primarily subject to compression-bending of the internal strata, with energy stored in the form of elastic strain energy, and have not reached their deformation limit. When Coal Seam 1 was excavated for the fourth time, with a cumulative excavation step length of 40 cm, the overlying rock layer experienced a second and third collapse, and tension crack L1 appeared for the first time during the third collapse (as shown in Figure 6b). At the fifth excavation of Coal Seam 1, the cumulative excavation step length reached 50 cm and the fourth collapse occurred (as shown in Figure 6c).
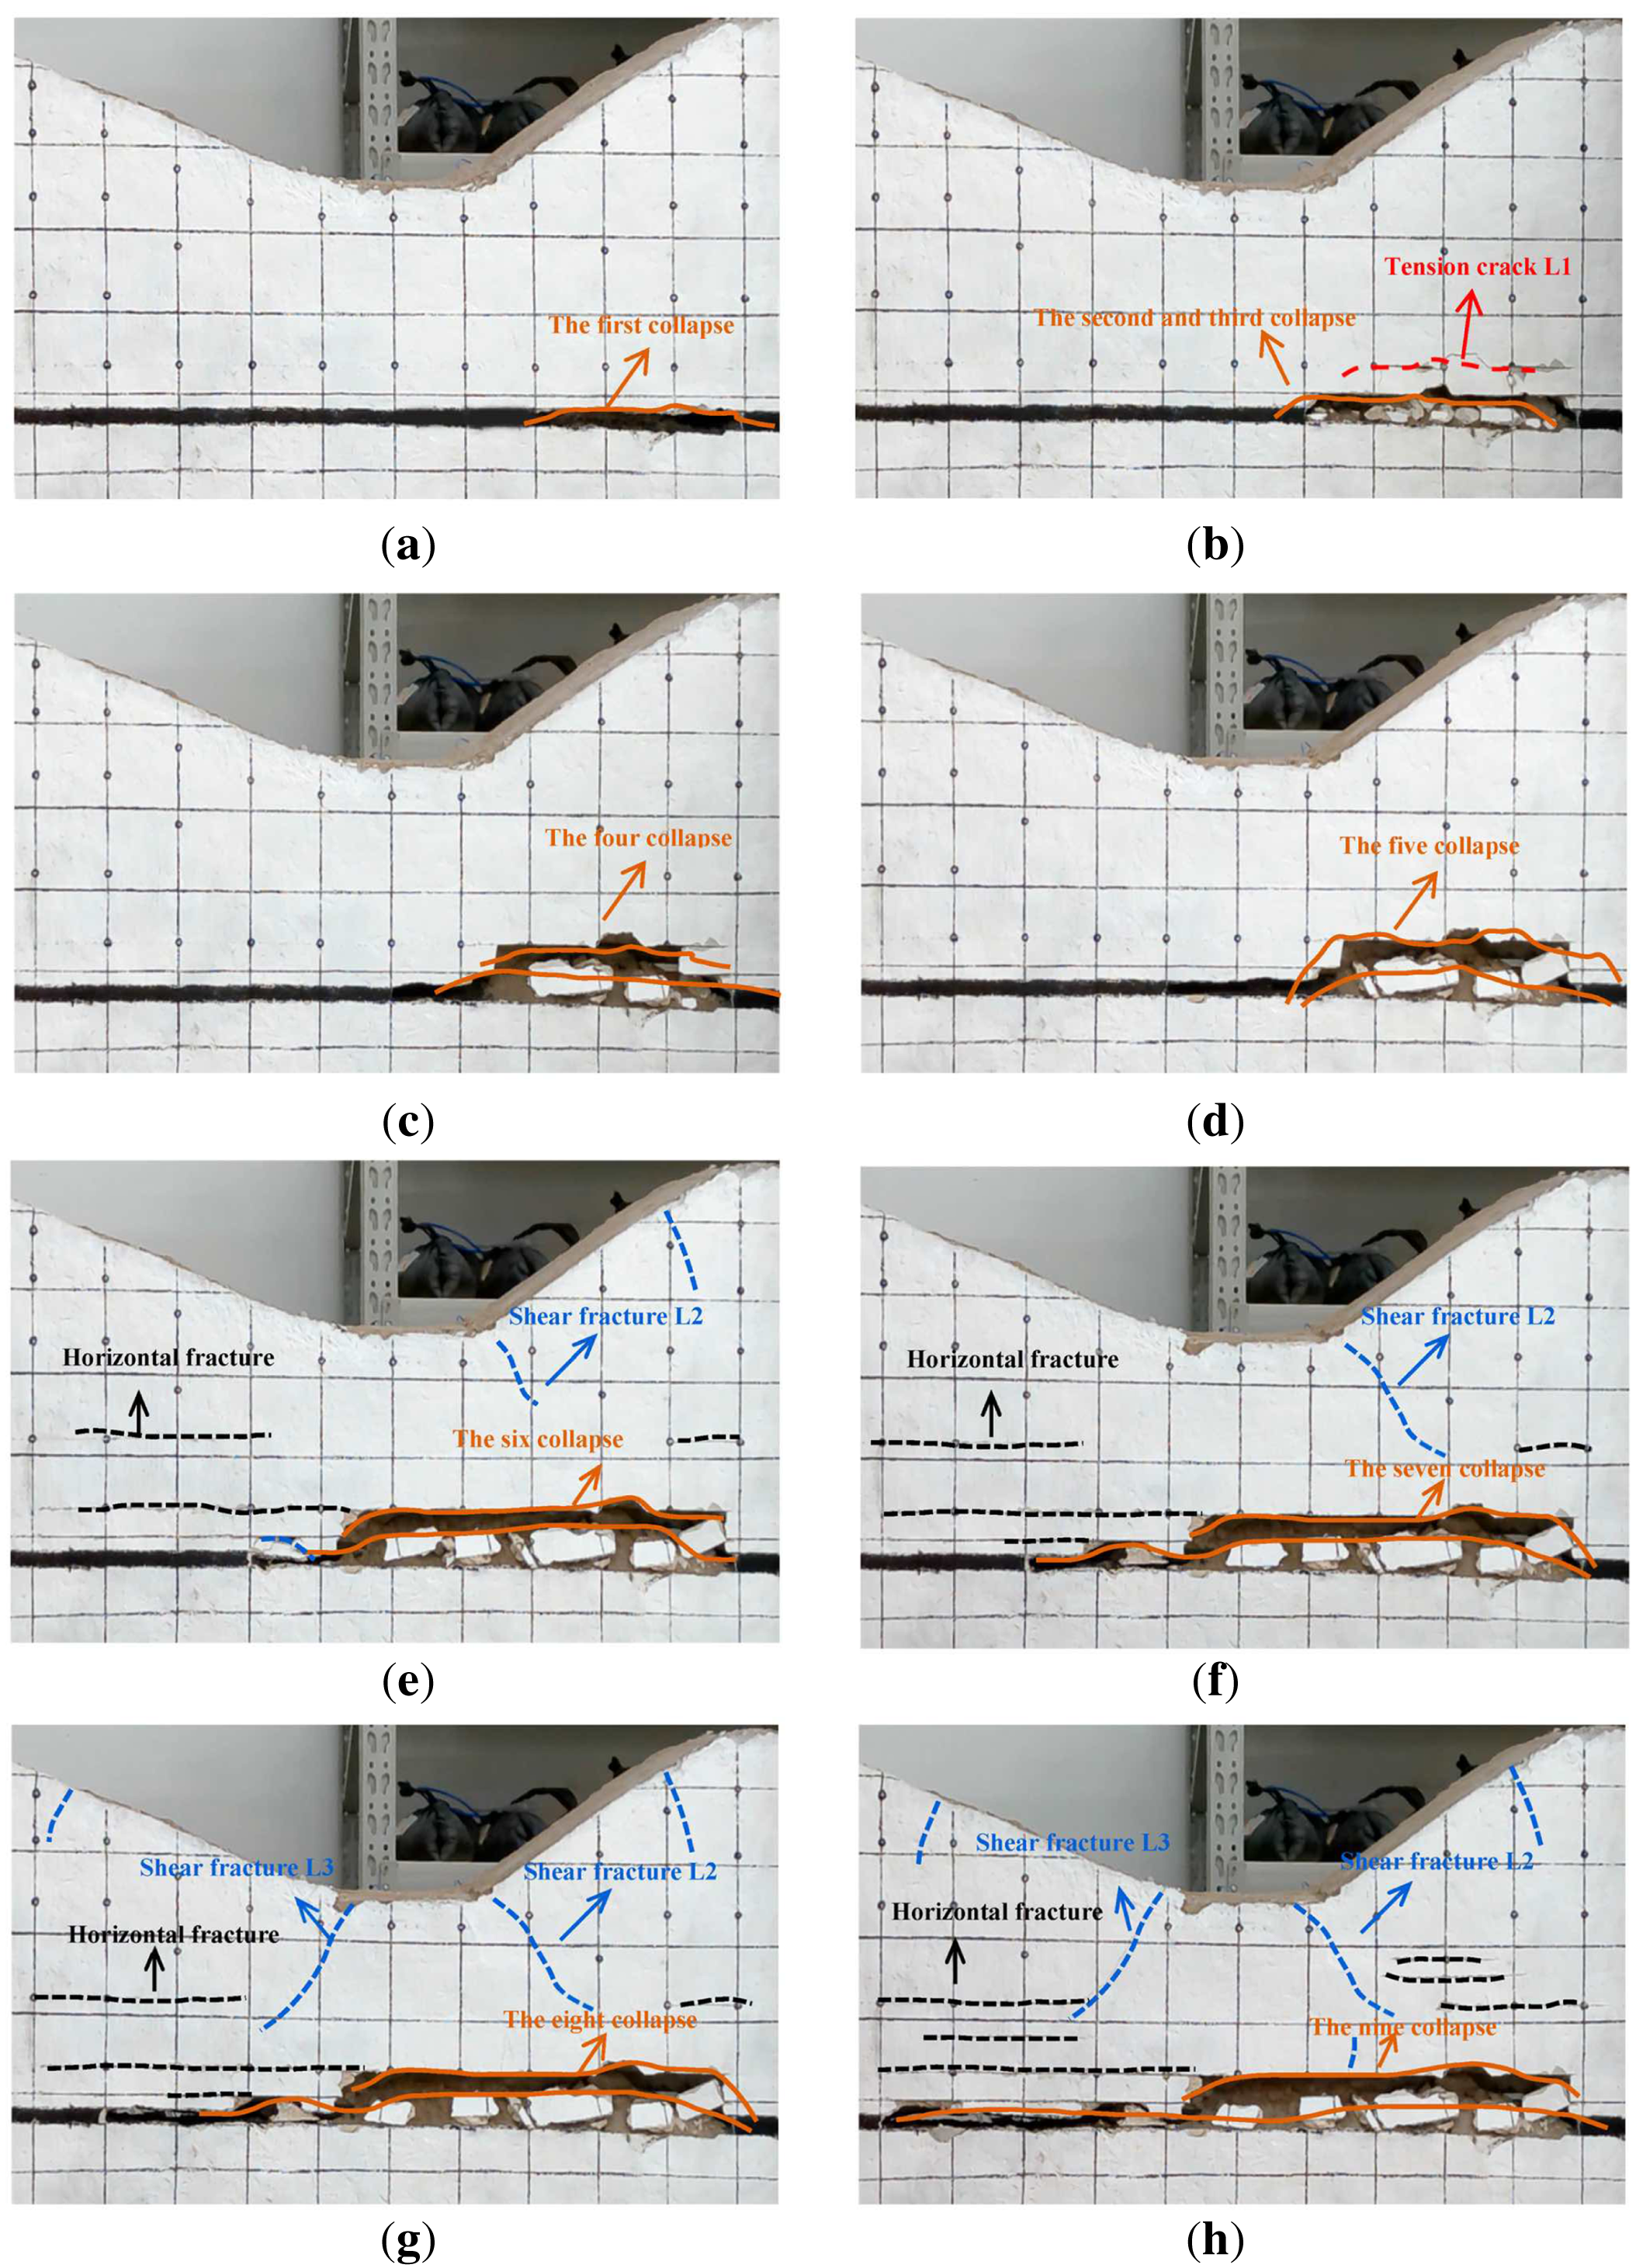
Figure 6. Excavation results of coal seam 1; (a) Results of the third excavation of Coal Seam 1; (b) Results of the fourth excavation of Coal Seam 1; (c) Results of the fifth excavation of Coal Seam 1; (d) Results of the sixth excavation of Coal Seam 1; (e) Results of the seventh excavation of Coal Seam 1; and (f–h) are the excavation results of Coal Seam 1 from eighth, ninth and tenth times
As the excavation proceeded, when Coal Seam 1 was excavated for the sixth time, the cumulative excavation step length reached 60 cm. Due to the relatively high hardness of the overlying strata, the force was transferred downward, causing the tension crack L1 to expand and penetrate, accompanied by the fifth collapse phenomenon (as shown in Figure 6d). When Coal Seam 1 was excavated for the seventh time, with a cumulative excavation step length of 70 cm, the overlying strata experienced its sixth collapse, and a shear fracture L2 forming an angle of approximately 50° with the slope surface appeared near the right slope foot, along with some transverse fractures (as shown in Figure 6e). The emergence of L2 is direct evidence that the shear stress within the slope exceeds the shear strength of the rock and soil, revealing a transition in the failure mode of the slope from vertical settlement-dominated to shear sliding-dominated. At the eighth excavation of Coal Seam 1, the cumulative excavation step length reached 80 cm and the seventh collapse took place (as shown in Figure 6f).
When Coal Seam 1 was excavated for the ninth time (as shown in Figure 6g), the cumulative excavation step length was 90 cm. The overlying strata experienced an eighth collapse, and a shear fracture L3 formed an angle of approximately 45° with the slope appeared near the left toe of the slope, along with some other shear fractures. At this time, the overlying strata had formed a potential sliding mass bounded by L2 and L3, with multiple transverse fractures running through its interior, causing the overall stability to deteriorate sharply. After the excavation of Coal Seam 1 was completed, the final failure pattern of the slope and the overlying strata is shown in Figure 6h.
Due to the stress release and structural loosening of the overlying strata caused by the excavation of Coal Seam 1, the shear fractures L2 and L3 in the slope toe area further propagated with the expansion of the goaf in Coal Seam 2, intensifying the movement of the overlying strata (as shown in Figure 7a–7c). When Coal Seam 2 was excavated for the sixth time, the cumulative excavation step length reached 60 cm, and the tenth collapse occurred (as shown in Figure 7d), causing the overlying rock layer to settle more significantly. When Coal Seam 2 was excavated up to the 7th time, with a cumulative excavation step length of 70 cm, the eleventh collapse occurred (as shown in Figure 7e). At this stage, signs of overall slope sliding began to appear, with shear fractures indicative of sliding emerging near the right slope shoulder and the upper part of the left slope (as shown in Figure 7f,7g). The fractures L2 and L3 at the slope toe outlined the preliminary form of a through going sliding surface in the overlying strata. Until the tenth excavation was completed, with a cumulative excavation step length of 100 cm, collapses continued to occur (as shown in Figure 7h,7i). Upon the completion of Coal Seam 2 excavation, the final failure patterns of the overlying strata and the slope are shown in Figure 7g–7l.
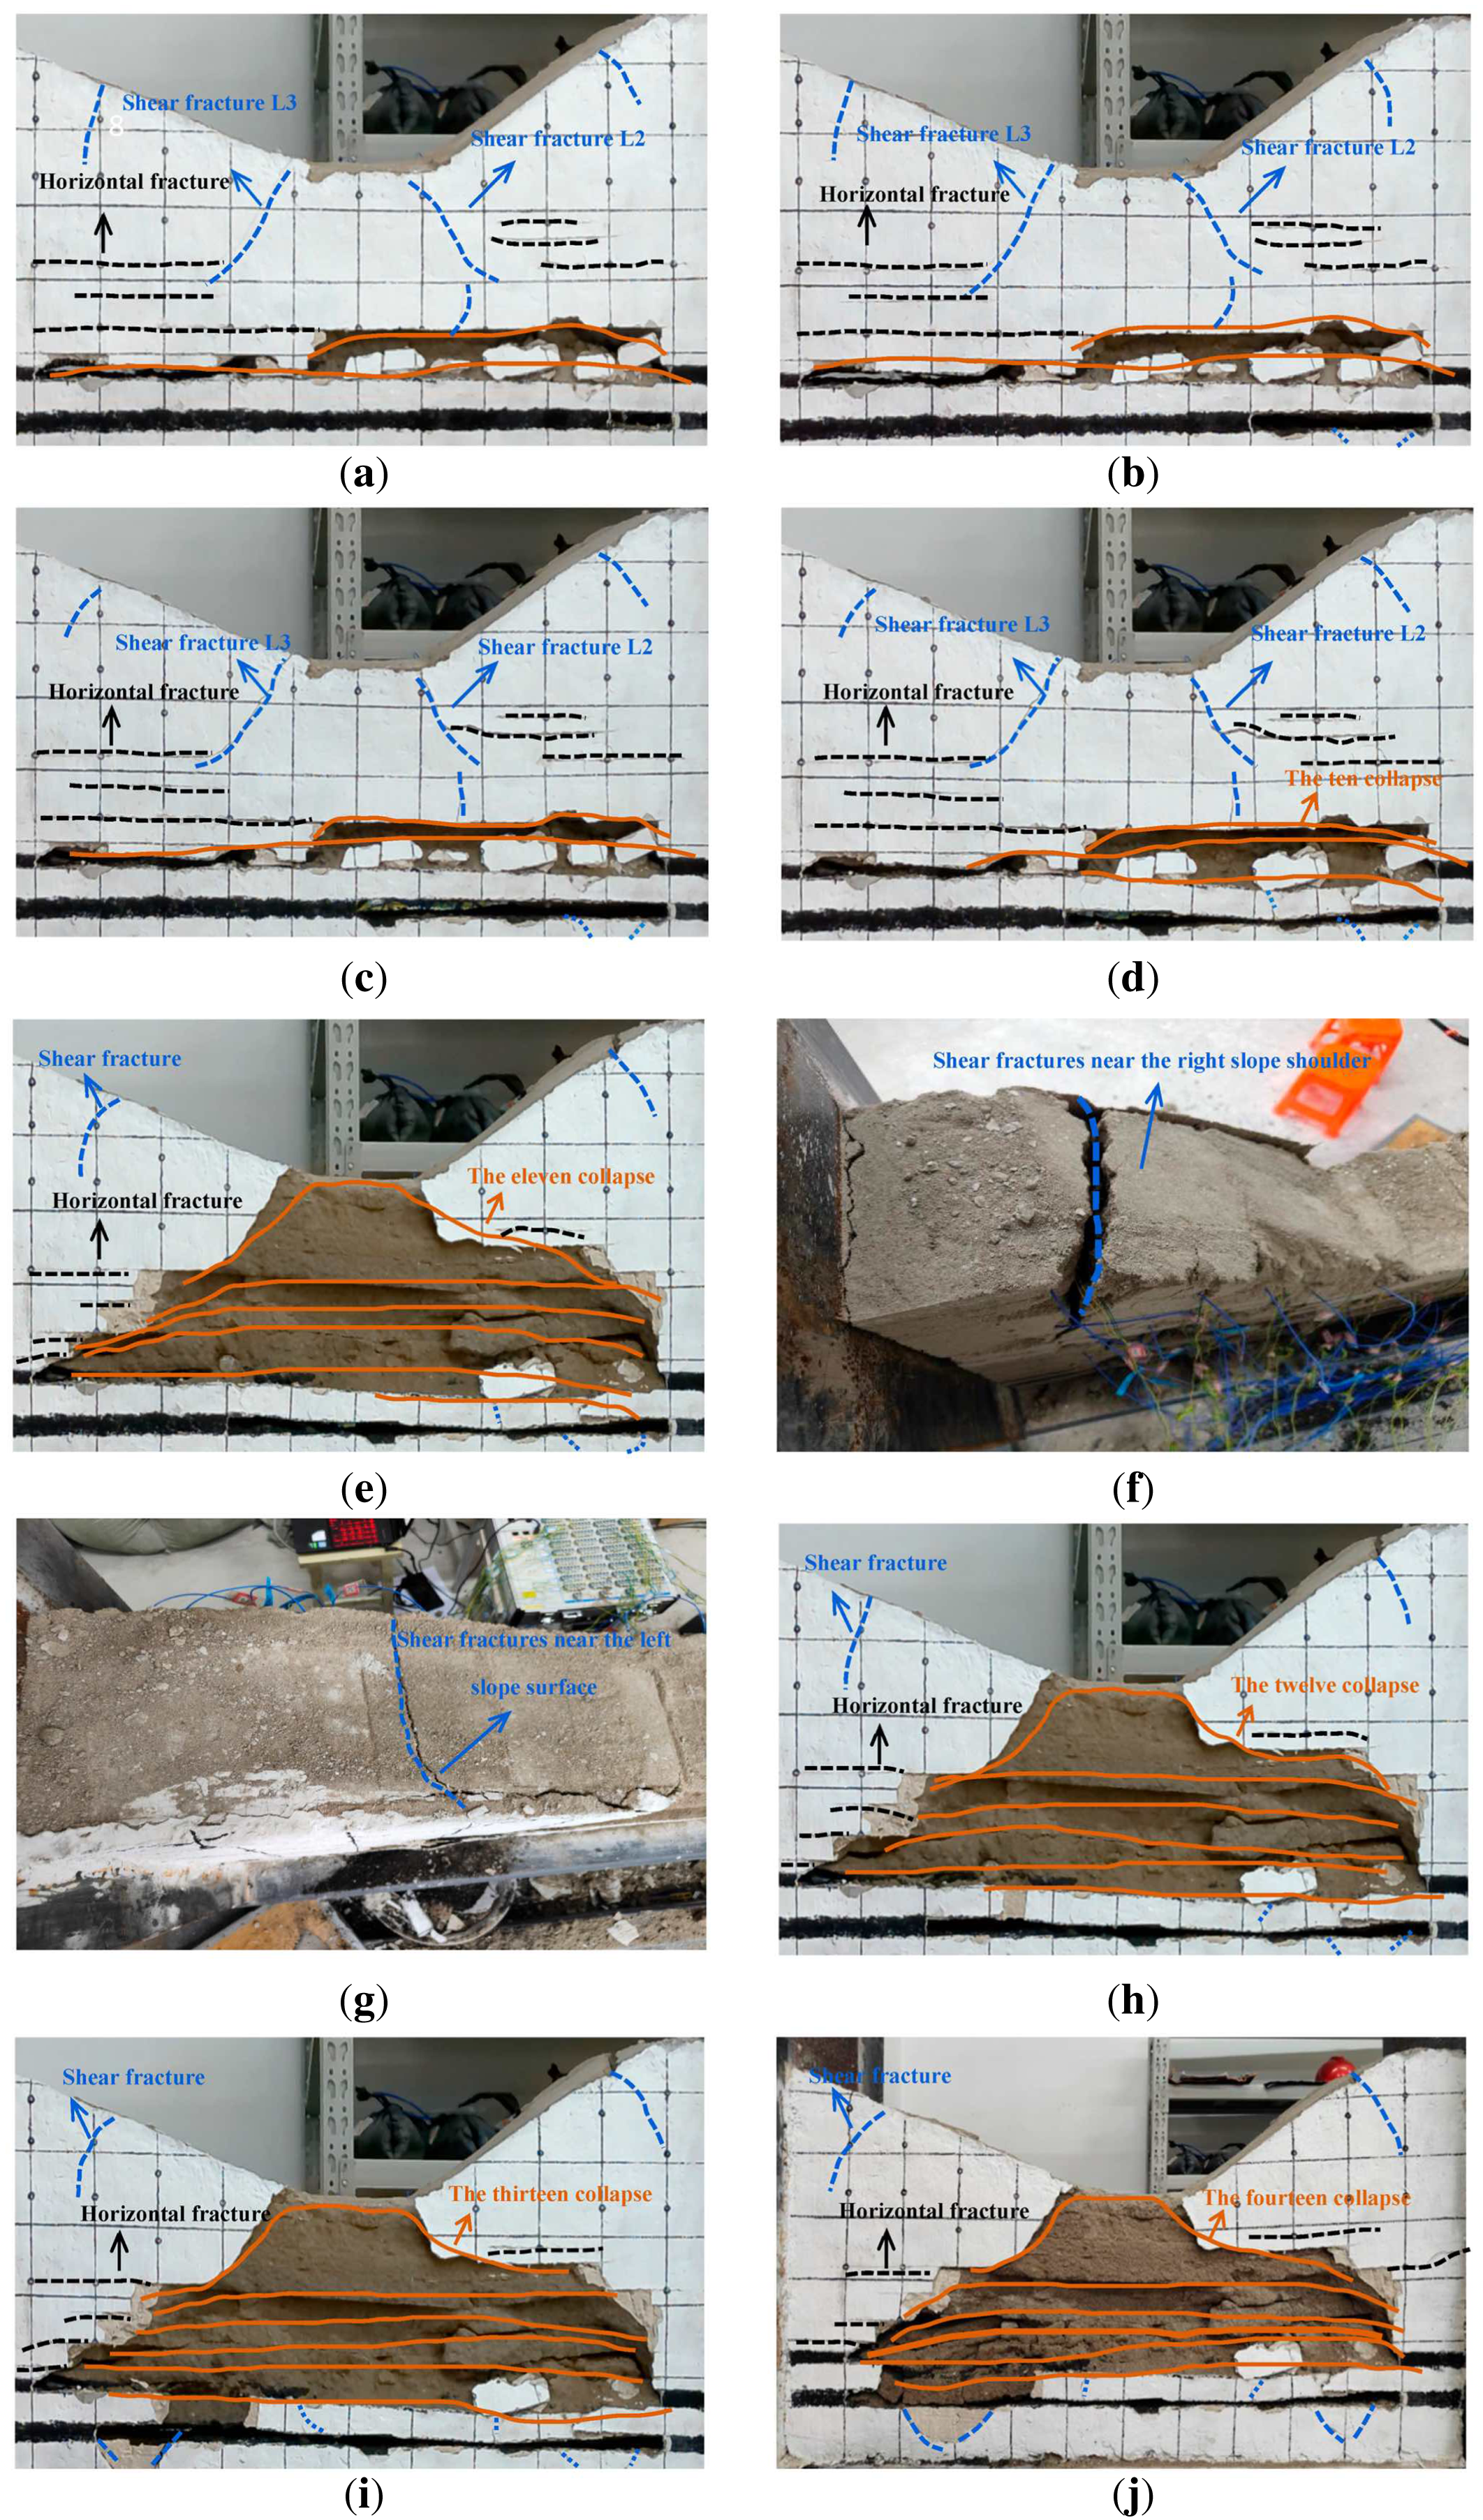
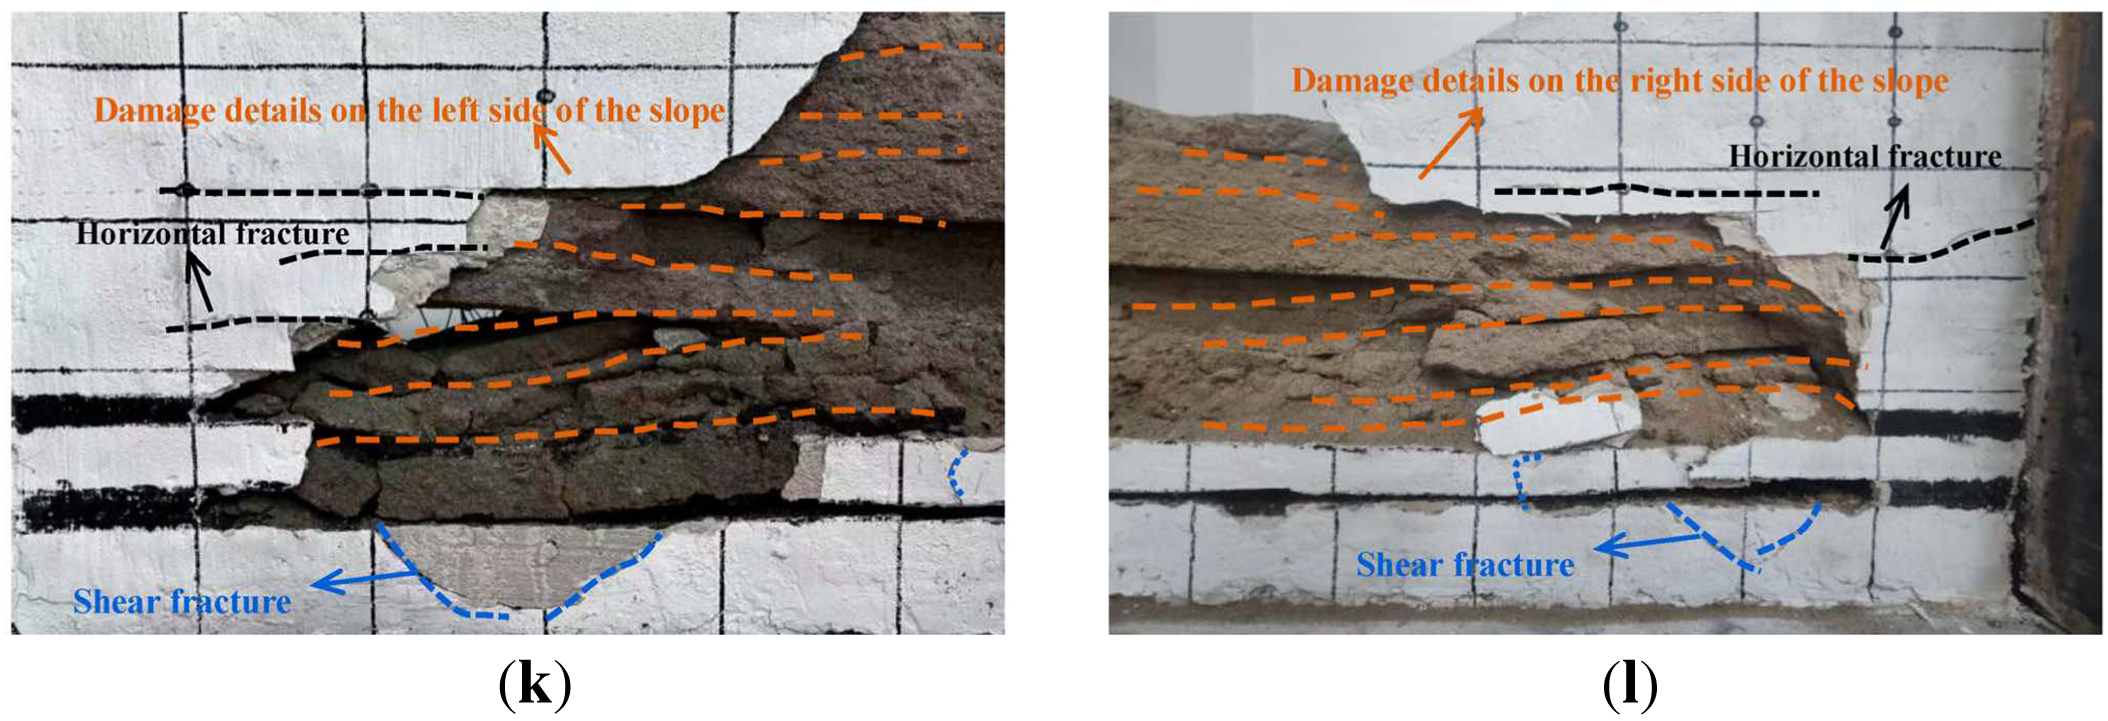
Figure 7. Excavation results of coal Seam 2; (a) Results of the first excavation of Coal Seam 2; (b) Results of the third excavation of Coal Seam 2; (c) Results of the fifth excavation of Coal Seam 2; (d) Results of the sixth excavation of Coal Seam 2; and (e–g) are the seventh excavation results of Coal Seam 2; (h) Results of the eighth excavation of Coal Seam 2; (i) Results of the ninth excavation of Coal Seam 2; and (g–l) are the tenth excavation results of Coal Seam 2
4.2. Characteristics of strain changes in overlying strata and slope
As the excavation progresses, the strain at monitoring points in different areas is shown in Figures 8–10. The strain data, primarily in the horizontal x-direction and vertical y-direction, reflect the evolution of strain and failure characteristics of the overlying strata and slope during the progressive excavation process. Based on comprehensive analysis of the surface failure images and strain responses of the overlying strata and slope: the initial deformation stage refers to the period when no fractures appear on the model surface and the strain at each measuring point changes slowly (excavation steps 1–3 of Coal Seam 1, 0–58 min); the fracture initiation and propagation stage is marked by the occurrence of tensile cracks and shear cracks, accompanied by strain peaks or tension-compression transitions (excavation steps 4–10 of Coal Seam 1, 58–190 min); the overall instability stage is characterized by the tendency of crack coalescence at the slope toe and slope shoulder, continuous overburden caving, and irreversible abrupt strain changes at multiple measuring points (during the excavation of Coal Seam 2, after 190 min).
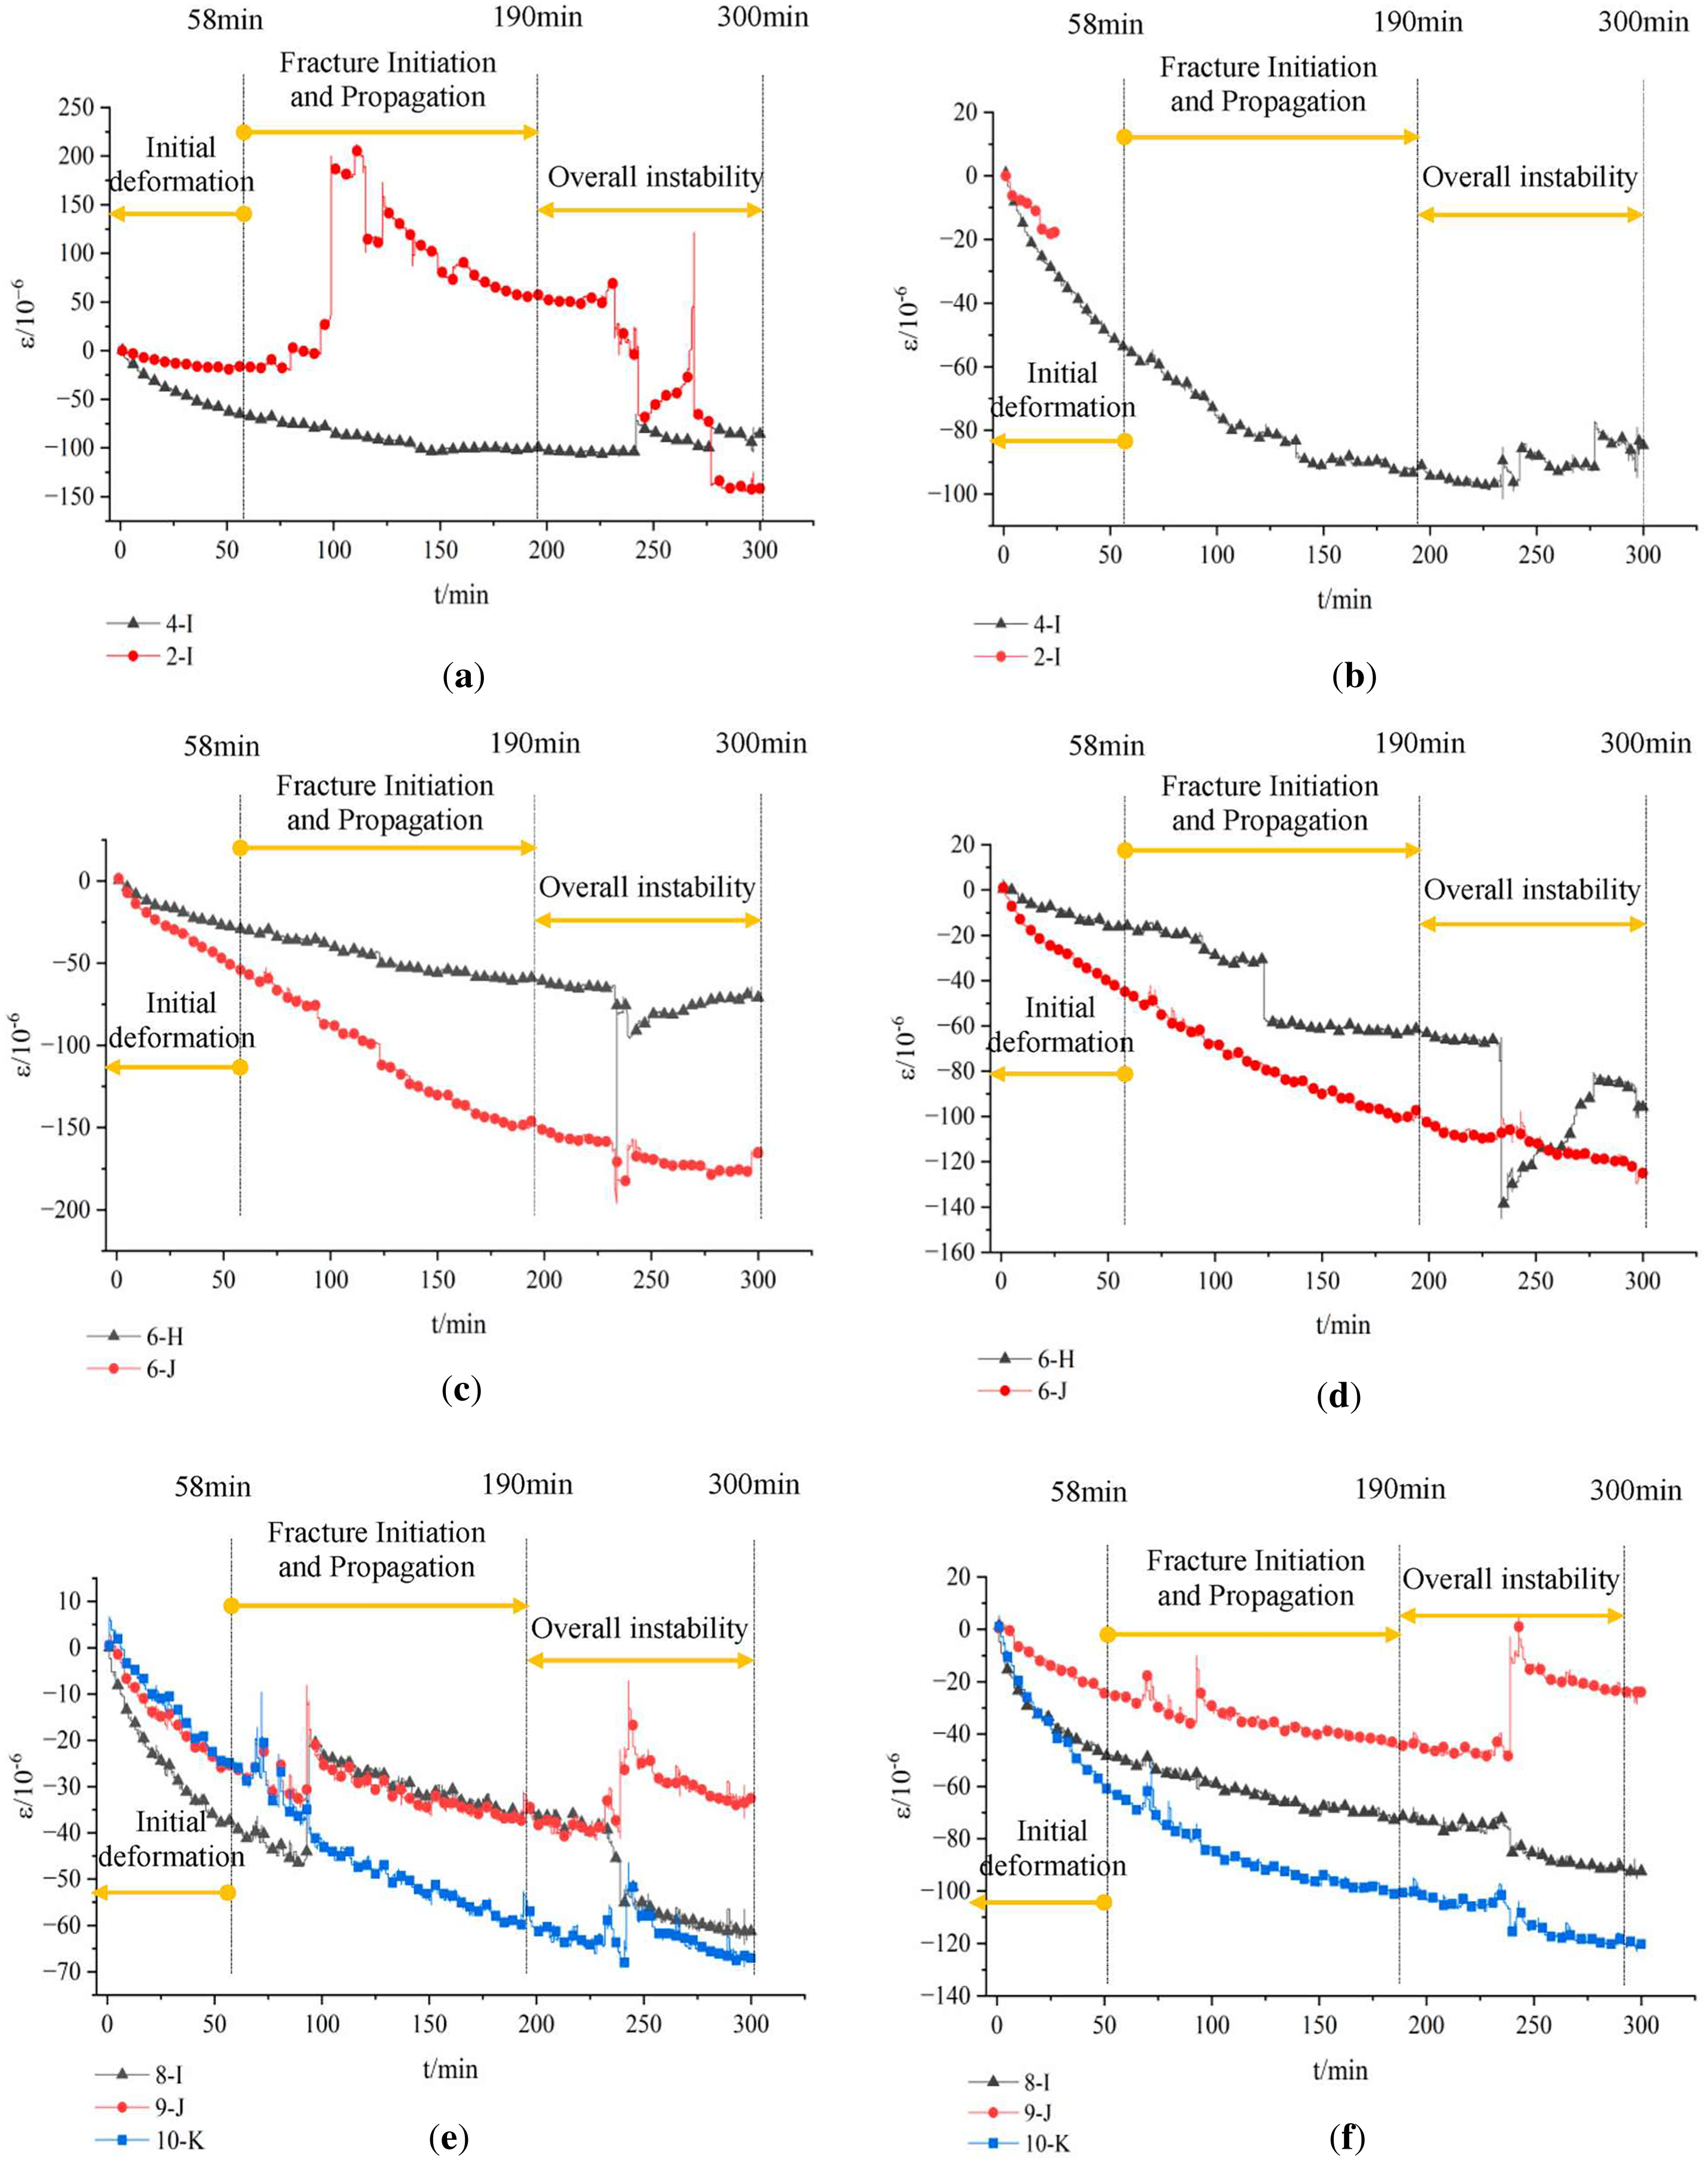
Figure 8. Strain at the monitoring points on the right side over time; (a) x-direction strain of 2-I, 4-I; (b) y-direction strain of 2-I, 4-I; (c) x-direction strain of 6-J, 6-H; (d) y-direction strain of 6-J, 6-H; (e) x-direction strain of 10-K, 9-J, 8-I; (f) y-direction strain of 10-K, 9-J, 8-I
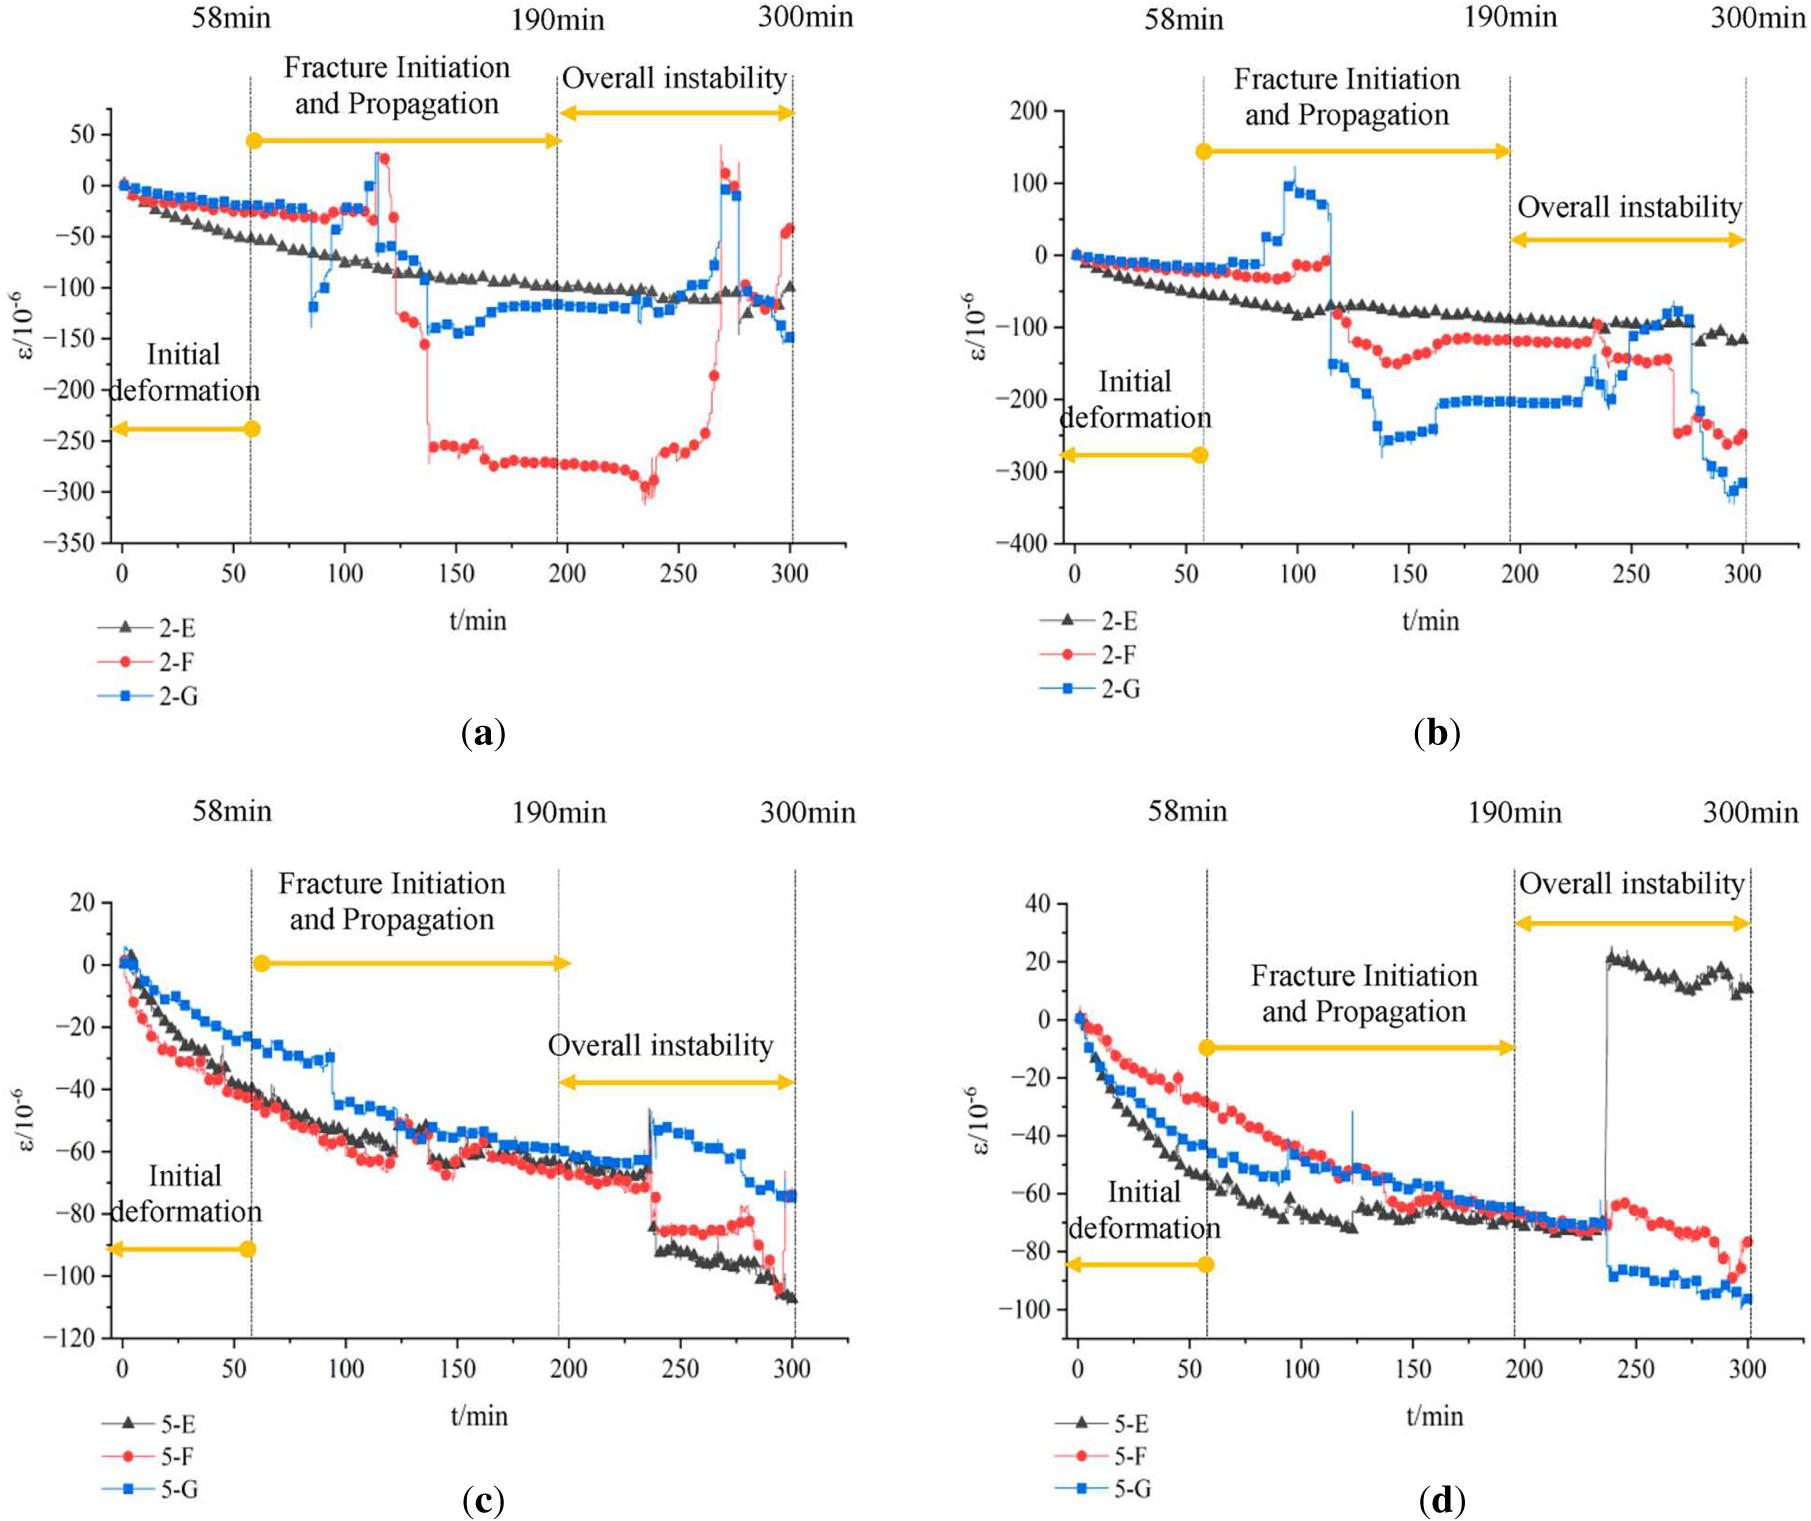
Figure 9. Strain at the monitoring points in the middle section over time; (a) x-direction strain of 2-G, 2-F, 2-E; (b) y-direction strain of 2-G, 2-F, 2-E; (c) x-direction strain of 5-G, 5-F, 5-E; (d) y-direction strain of 5-G, 5-F, 5-E
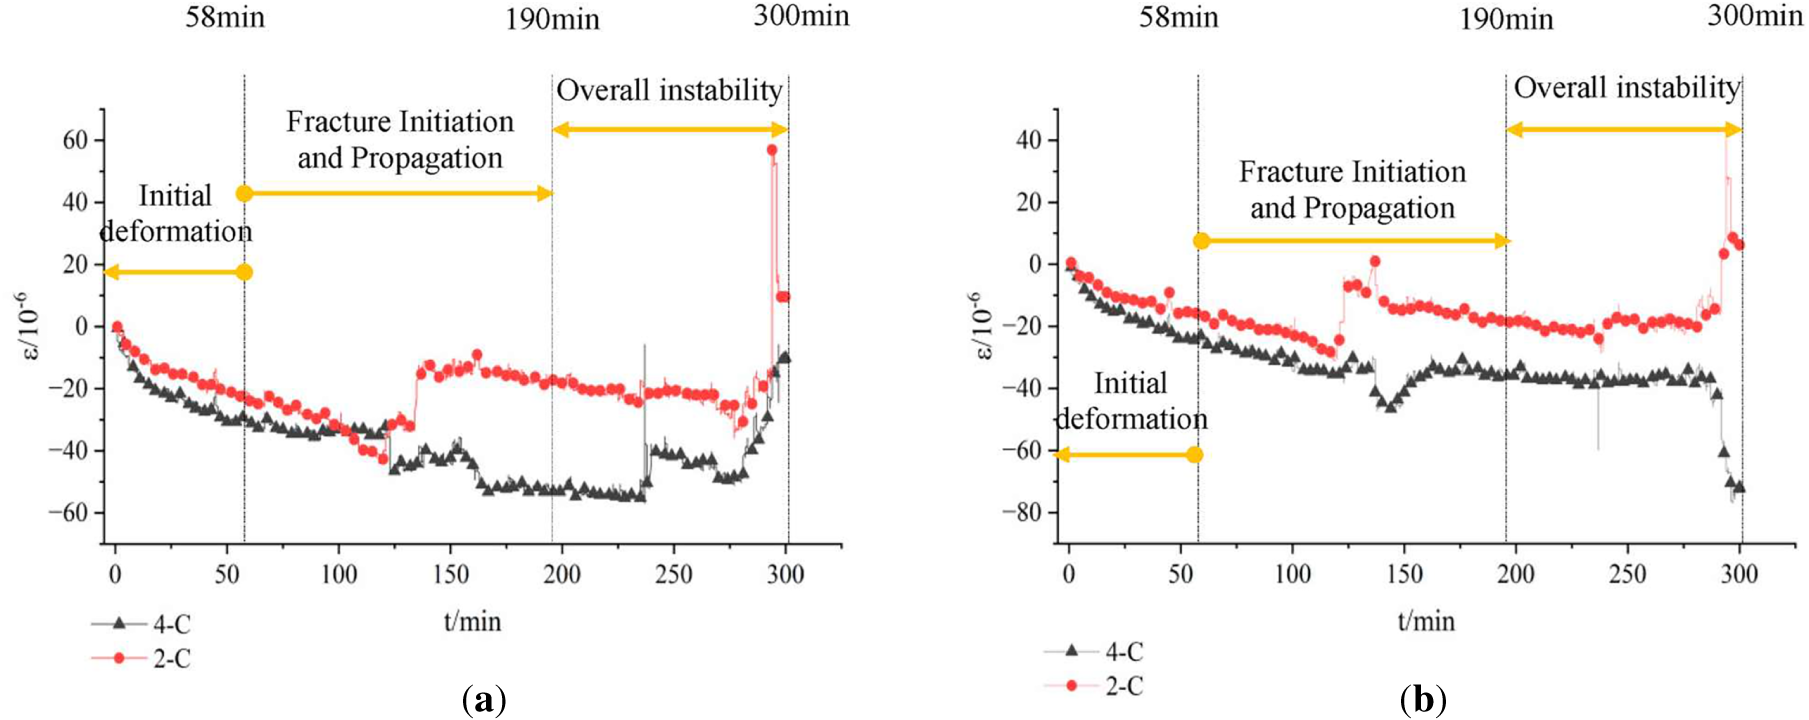
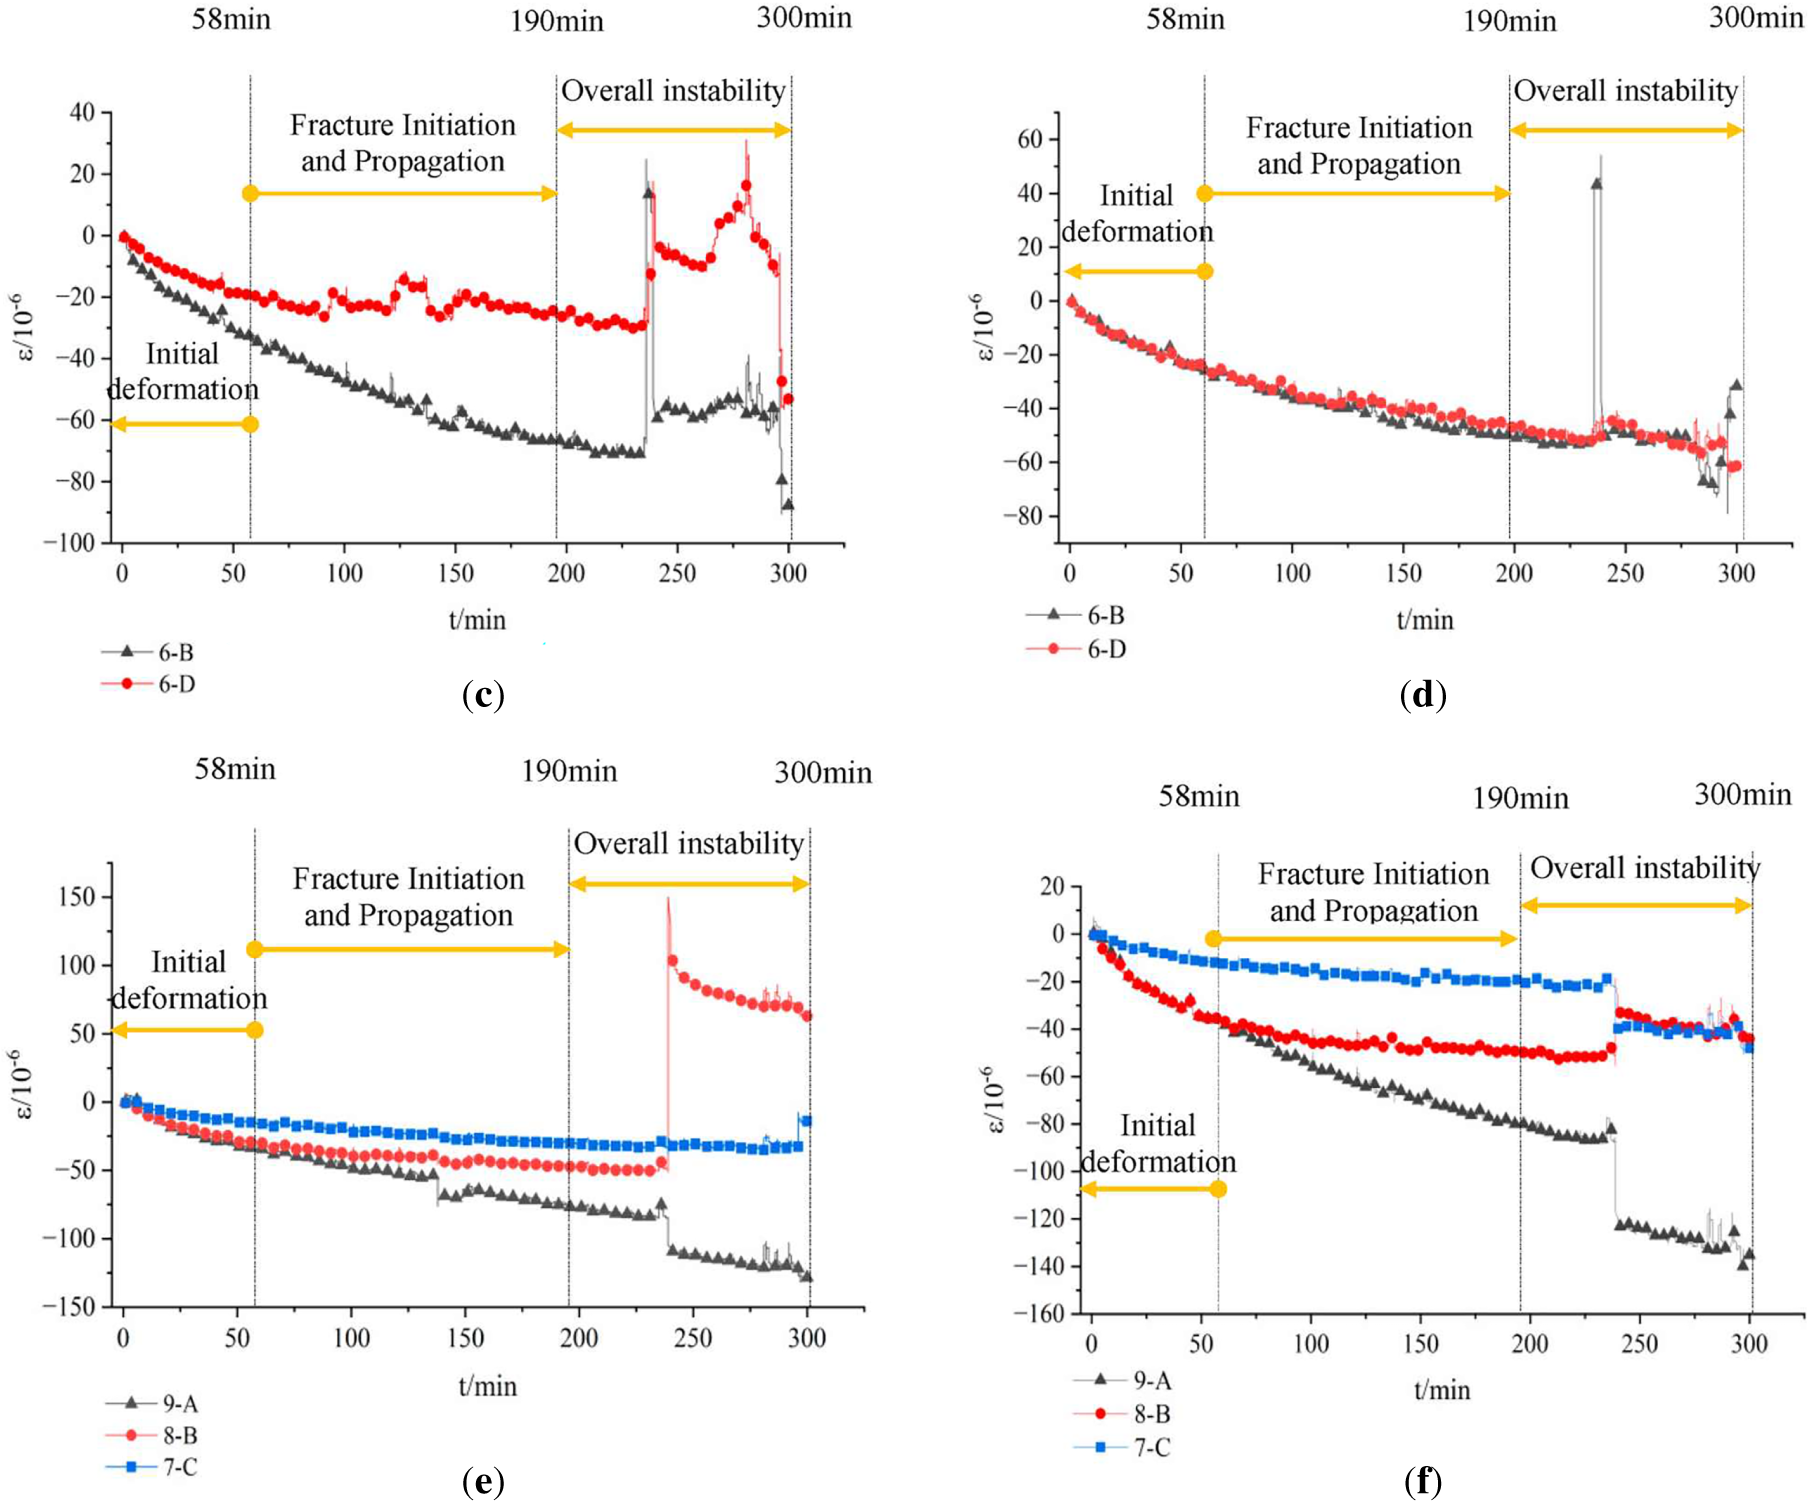
Figure 10. Strain at the monitoring points on the left side over time; (a) x-direction strain of 2-C, 4-C; (b) y-direction strain of 2-C, 4-C; (c) x-direction strain of 6-D, 6-B; (d) y-direction strain of 6-B, 6-D; (e) x-direction strain of 7-C, 8-B, 9-A; (f) y-direction strain of 7-C, 8-B, 9-A
(1) Monitoring point in the right-side area
The monitoring points in the right-side area, located near the starting side of the excavation, were the first to be affected by mining. During the initial deformation stage, although no macroscopic fractures appeared in the overlying strata and slope surface, the strain values at each monitoring point already showed an increasing trend, indicating that stress adjustment occurred within the rock mass as the goaf began to form. The sensing line of gauge 2-I sensing line was damaged during the third excavation stage, so only its strain data in the x-direction could be obtained subsequently. Post-test anatomical inspection confirmed that the failure was caused by accidental mechanical shearing of the external lead wire by the excavation tool during operation. This damage resulted from an accidental failure during experimental operation and did not involve the silicone encapsulation body or internal sensitive grid of the strain gauge. The remaining 19 monitoring points, including multiple points directly penetrated by macroscopic fractures, all maintained stable, continuous signal output throughout the test, verifying the reliability of the strain gauges. The x-direction strain data of this point still fully captured the critical transition process of the overlying strata from compression to tension. Combined with the complete and continuous data records from the other 19 measuring points, this single operational accident has no substantial impact on the overall conclusions of the study.
After entering the stage of fissure initiation and propagation, during the fourth excavation of Coal Seam 1, the second and third collapses occurred in the overlying strata. The strain values in the x and y directions at each monitoring point showed slight fluctuations. Among them, the middle x-direction at monitoring point 2-I near Coal Seam 1 exhibited minor compressive strain fluctuations, even shifting toward tensile stress, indicating a local tensile trend in the overlying strata during excavation, which corresponds to the first appearance of tensile fracture L1 in the overlying strata on the right-side area (as shown in Figure 6b). Monitoring points 8-I, 9-J, and 10-K near the slope surface exhibited compressive strain fluctuations in both the x and y directions, indicating that subsidence of the overlying strata had commenced and that the load was being transferred towards the front and deeper parts of the slope. When Coal Seam 1 was excavated for the sixth and seventh times, the fifth and sixth collapses occurred, respectively. The x-direction strain at all monitoring points fluctuated. For instance, monitoring point 2-I near Coal Seam 1 showed an increase in x-direction strain from 26 × 10−6 to 178.67 × 10⁻⁶ during the sixth excavation, indicating an enhanced horizontal tensile effect on the overlying strata in that area. During the seventh excavation, the strain in the x-direction abruptly changed from a tensile strain of 178.57 × 10⁻⁶ to a compressive strain of −18.67 × 10⁻⁶, then rebounded to 210.65 × 10⁻⁶, and finally decreased to 112.5 × 10⁻⁶. This intense alternating tension-compression fluctuation reflects the cyclic process of “bending-fracturing-stress release” experienced by the overlying strata under the influence of mining activities. At monitoring points near the slope surface, such as 8-I, 9-J, and 10-K, both x- and y-direction strains showed significant fluctuations during the sixth excavation, predominantly manifesting as compressive strain, indicating that the ongoing subsidence of the overlying strata caused settlement of the right-side slope. The overlying rock layer can cause subsidence of the right slope body during continuous settlement. During the seventh excavation, a shear fracture L1, forming an angle of approximately 50° with the slope surface, was induced near the slope toe (as shown in Figure 6e), indicating that the shear plastic deformation of the overlying strata in this area intensified, and the bearing capacity significantly decreased. When Coal Seam 1 was excavated for the eighth time, the compressive strain in the y-direction at monitoring point 6-H near the slope toe suddenly increased from −30.18 × 10⁻⁶ to −58.09 × 10⁻⁶, further confirming the continuous propagation of shear fractures.
After entering the overall instability stage, the tenth collapse occurred when Coal Seam 2 was excavated for the sixth time. The compressive strain in the x-direction at point 6-H near the slope toe reached a peak of −196.29 × 10⁻⁶, and the compressive strain in the y-direction increased from −68.14 × 10⁻⁶ to −143.69 × 10⁻⁶, indicating that the overall subsidence of the overlying strata and the internal strata of the slope accelerated, and the overall sliding trend of the slope increased. The compressive strains in both the x- and y-directions at monitoring points 8-I, 9-J, and 10-K near the slope surface showed significant fluctuations, with the most pronounced fluctuation at monitoring point 9-J near the slope shoulder. The compressive strain in the x-direction first decreased from −33.05 × 10⁻⁶ to −7.66 × 10⁻⁶ and then rebounded to −28.25 × 10⁻⁶, while the strain in the y-direction suddenly changed from a compressive strain of −43.11 × 10⁻⁶ to a tensile strain of 4.79 × 10⁻⁶, and then returned to a compressive strain of −18.2 × 10⁻⁶. This alternating process of tension and compression reveals significant settlement in the area near the slope shoulder on the right side of the slope under the influence of mining activities. The fracture initiation and propagation stage.
(2) Monitoring points in the middle area
The monitoring point in the middle area is located in the middle of the slope, directly within the key deformation zone of the overlying strata above the goaf. The multiple sudden changes in strain values reflect the bending, settlement, and collapse processes of the overlying strata during mining. At the initial stage of coal seam excavation, the compressive strains in both the x-directions and y-directions at monitoring points 2-E, 2-F, and 2-G in the overlying strata increased gradually, indicating that settlement of the overlying strata had already begun, but the structure was still in the elastic adjustment phase.
After entering the stage of fracture initiation and propagation, when the fourth excavation of Coal Seam 1 occurred, the x-direction of monitoring point 2-G decreased from −23.46 × 10⁻⁶ to −138.84 × 10⁻⁶, and the y-direction suddenly changed from a compressive strain of −13.41 × 10⁻⁶ to a tensile strain of 28.26 × 10⁻⁶. At this time, the second collapse of the overlying strata occurred (as shown in Figure 6b), indicating that the overlying strata were subjected to horizontal compression and vertical tension during the caving process of the goaf roof. The middle part of the overlying strata had entered the plastic deformation stage, with local bending and tensile damage occurring. When Coal Seam 1 was excavated for the sixth time, the x-direction strain at monitoring point 5-G near the right slope toe in the overlying strata increased from −28.72 × 10⁻⁶ to −45 × 10−6, while the y-direction compressive strain first decreased from −53.65 × 10⁻⁶ to −40.71 × 10⁶ and then increased to −51.25 × 10⁻⁶, reflecting intensified stress release in this slope toe area and rebound deformation of the rock mass towards the free face. When the seventh excavation of Coal Seam 1 occurred, the x-direction strain at monitoring point 2-F changed from a compressive strain of −34.95 × 10⁻⁶ to a tensile strain of 27.29 × 10⁻⁶, and the compressive strain in the y-direction increased to −79.99 × 10⁻⁶. The strain in the x-direction at monitoring point 2-G changed from a compressive strain of −23.46 × 10⁻⁶ to a tensile strain of 32.08 × 10⁻⁶, while the strain in the y-direction changed from a tensile strain of 68.48 × 10⁻⁶ to a compressive strain of −167.17 × 10⁻⁶. Other points exhibited minor fluctuations. This stage of intense compression-tension transitions coincided with the sixth collapse (as shown in Figure 6e), indicating continuous bending and subsidence in the middle region of the overlying strata. The combined effects of horizontal stress release and vertical load transfer further weakened the rock mass structure.
After entering the overall instability stage, during the sixth excavation of Coal Seam 2, the x-direction and y-direction strains at monitoring points 2-F and 2-G near the excavation side both showed significant fluctuations. The x-direction compressive strain at monitoring point 5-E near the left slope toe of the overlying strata decreased to −92.97 × 10⁻⁶, and the y-direction strain transitioned from a compressive strain of −71.7 × 10⁻⁶ to a tensile strain of 23 × 10−6. At this time, the tenth collapse occurred (as shown in Figure 7d), indicating that as the goaf of the lower coal seam expanded, the overall subsidence of the overlying strata accelerated.
(3) Monitoring points in the left area
The left area, being far from the excavation starting side, exhibited strain responses that lagged behind those of the right and middle areas, gradually showing significant deformation as the goaf expands. At the initial stage of excavation of Coal Seam 1, the overlying strata and slope were in the initial deformation stage. Points in the x-direction exhibited compressive strain, indicating that the excavation had minimal impact on the left side initially, with only slight stress adjustments occurring within the overlying strata and slope interior. Points in the y-direction all showed compressive strain, reflecting that the overlying strata began to settle under the effect of self-weight.
After entering the stage of fracture initiation and propagation, when Coal Seam 1 was excavated for the eighth time, significant fluctuations appeared in both the x-direction and y-direction strains at monitoring point 2-C near the coal seam and monitoring point 4-C in the overlying strata. Specifically, the x-direction strain at monitoring point 2-C decreased from a compressive strain of −40.25 × 10⁻⁶ to −33.55 × 10⁻⁶, and the y-direction strain decreased from a compressive strain of −23.00 × 10⁻⁶ to −9.58 × 10⁻⁶. This indicates that after the goaf expanded to a certain extent, stress release occurred in the overlying strata of this area, weakening the horizontal constraint and locally entering the unloading rebound stage. When Coal Seam 1 was excavated for the ninth time, a shear fracture L3 appeared near the slope toe on the left slope (as shown in Figure 6e). The strain in the x-direction of monitoring point 6-D nearby increased from compressive strain −16.77 × 10⁻⁶ to −26.31 × 10⁻⁶ and then decreased to −20.10 × 10⁻⁶. The y-direction strain also showed slight fluctuations, reflecting that the slope toe area underwent repeated stress adjustments during the formation of the shear fracture, and local shear stress concentration led to plastic deformation of the rock mass. Monitoring points 9-A, 8-B, and 7-C near the slope surface on the left side all showed minor fluctuations, and the overall compressive stress remained relatively stable, indicating that although the slope surface area was affected by mining activities, it had not yet formed a through-going failure.
After entering the overall instability stage, when Coal Seam 2 was excavated for the sixth time, significant fluctuations in the strains occurred in both the x-directions and y-directions. The strain in the x-direction near the slope surface monitoring point 8-B suddenly changed from compressive strain to tensile strain, with a peak tensile strain of 150.11 × 10⁻⁶. In the y-direction, the strain decreased from a compressive strain of −50.80 × 10⁻⁶ to −20.13 × 10⁻⁶, and then increased to −31.15 × 10⁻⁶. The monitoring point 6-D near the left slope toe showed a peak tensile strain of 17.73 × 10⁻⁶ in the x-direction. The monitoring point 6-B inside the left overlying strata showed a peak tensile strain of 24.92 × 10⁻⁶ in the x-direction and then decreased. The strain in the x-direction at monitoring point 9-A increased from a compressive strain of −74.21 × 10⁻⁶ to −109.74 × 10⁻⁶, and in the y-direction, it increased from a compressive strain of −79.55 × 10⁻⁶ to −123.16 × 10⁻⁶. These variations reflect the redistribution of internal stress within the left slope, where the coupling of horizontal compression and vertical settlement significantly increased the risk of local instability. This phenomenon coincided with the occurrence of the tenth collapse (as shown in Figure 7d). During subsequent excavations, the strain curves exhibited intensified fluctuations, with multiple sudden changes in both the x-direction and y-direction, indicating continuous collapse of the overlying strata and progressive slope instability.
4.3. In-Situ calibration and measurement accuracy verification of the flexible strain gauge
To verify the influence of silicone polymer on the gauge factor of strain gauges, quantitative verification was conducted on the fabricated silicone polymer flexible strain gauges and traditional metal foil strain gauges using the same-model in-situ comparative calibration method. At 10 monitoring points in the physical model (right area: 2-I, 4-I, 6-H, 9-J; middle area: 2-F, 5-F; left zone: 2-C, 4-C, 6-D, 8-B) (as is shown in Figure 3), traditional metal foil strain gauges and flexible silicone polymer strain gauges were embedded simultaneously. The center distance between the two strain gauges at the same position was no more than 5 mm, with consistent embedding depth and orientation, to ensure both were exposed to the identical mechanical environment.
The experimental results were analyzed in two stages. In the first stage (before fracture penetration), both conventional strain gauges and encapsulated strain gauges functioned normally. A small number of monitoring points (e.g., 2-I, 6-H, 9-J, 8-B) were penetrated by fractures in the later stage, but still provided valid data prior to crack penetration. The strain ratio calibration curves of the monitoring points are presented in Figures 11–13. All data points are distributed near the 1:1 response line, showing a linear correlation. Before fracture penetration, the output strain ratio of the silicone polymer flexible strain gauge to the conventional strain gauge ranges from 0.976 to 0.983, with an average ratio of approximately 0.980, corresponding to a gauge factor deviation of about −2%. The calibration deviation is far below the allowable error range of 5% for geotechnical engineering physical model tests [30–32], and the measurement accuracy satisfies the experimental requirements. In the second stage (after fracture propagation and penetration), some traditional strain gauges suffer fracture failure (Figure 14) and can no longer deliver valid data. By contrast, the silicone polymer strain gauges at the corresponding positions remain structurally intact. Relying on the fracture bridging capability of their high-elongation encapsulation layer, they continuously output strain signals matching the fracture propagation and penetration process until the test concludes. This comparison verifies the limitations of conventional strain gauges in physical model experiments of brittle similar materials, as well as the superiority of silicone polymer flexible strain gauges in realizing continuous monitoring of the entire deformation and failure process, from initial deformation, fracture initiation and propagation to overall instability.
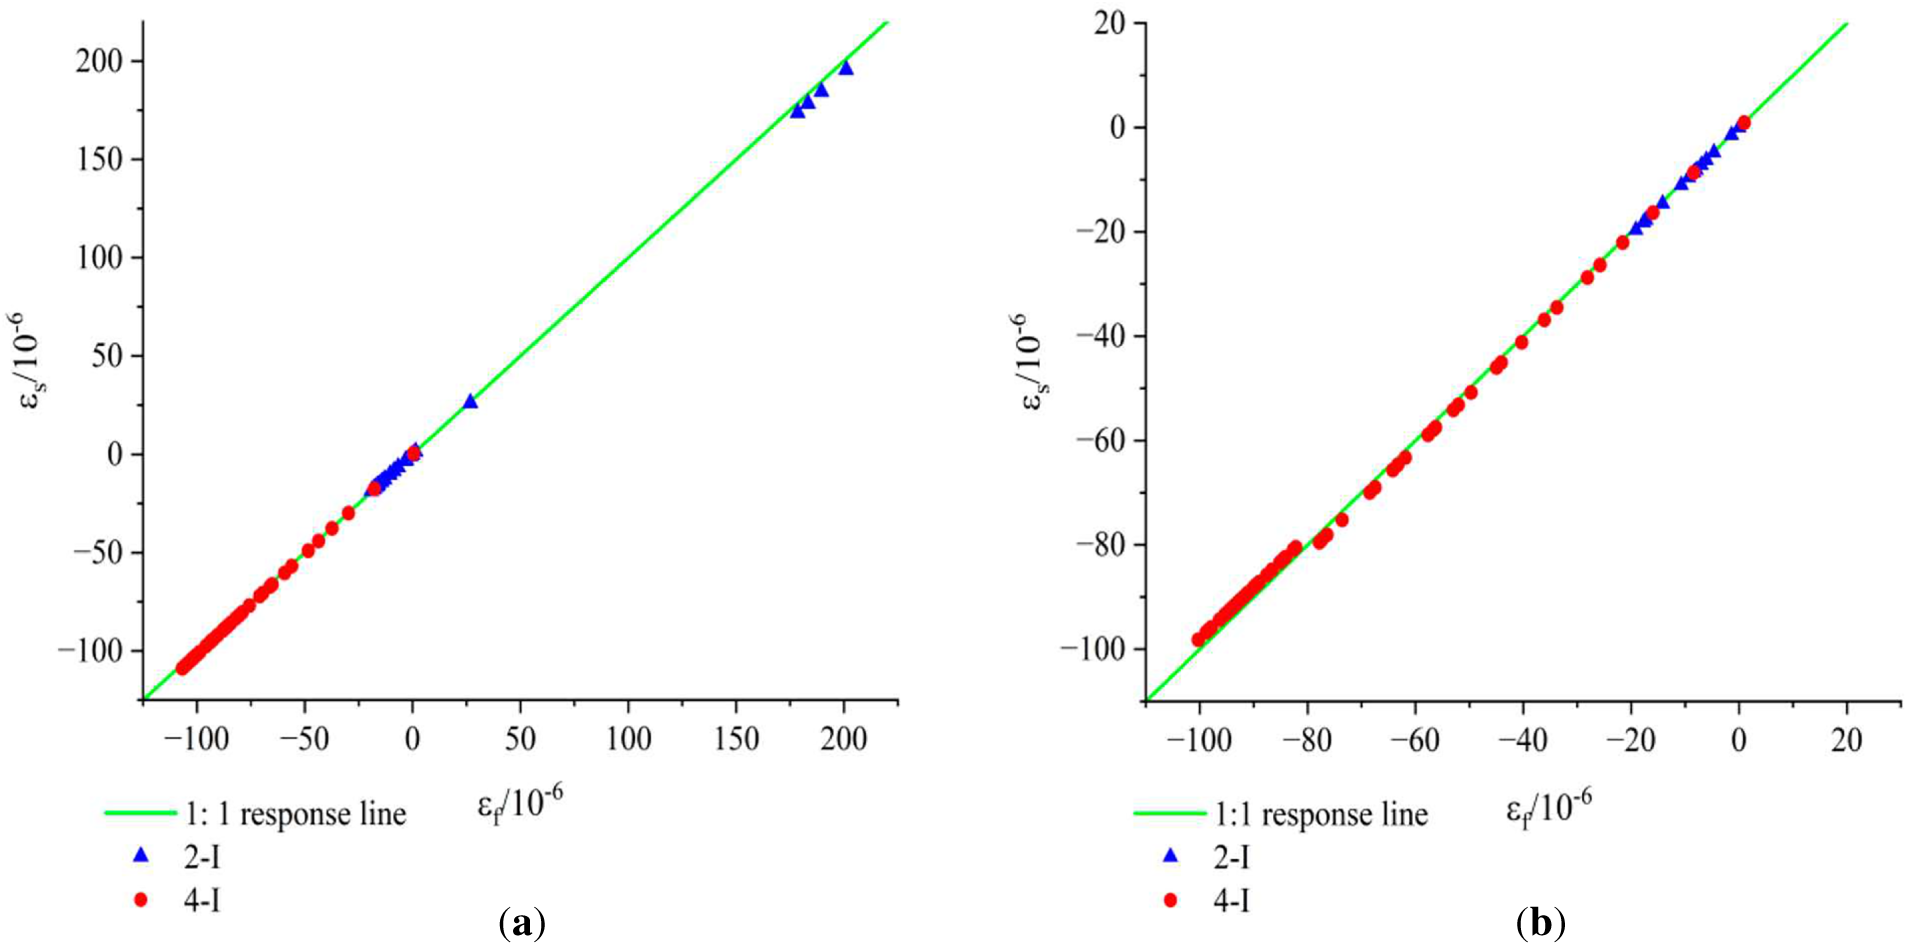
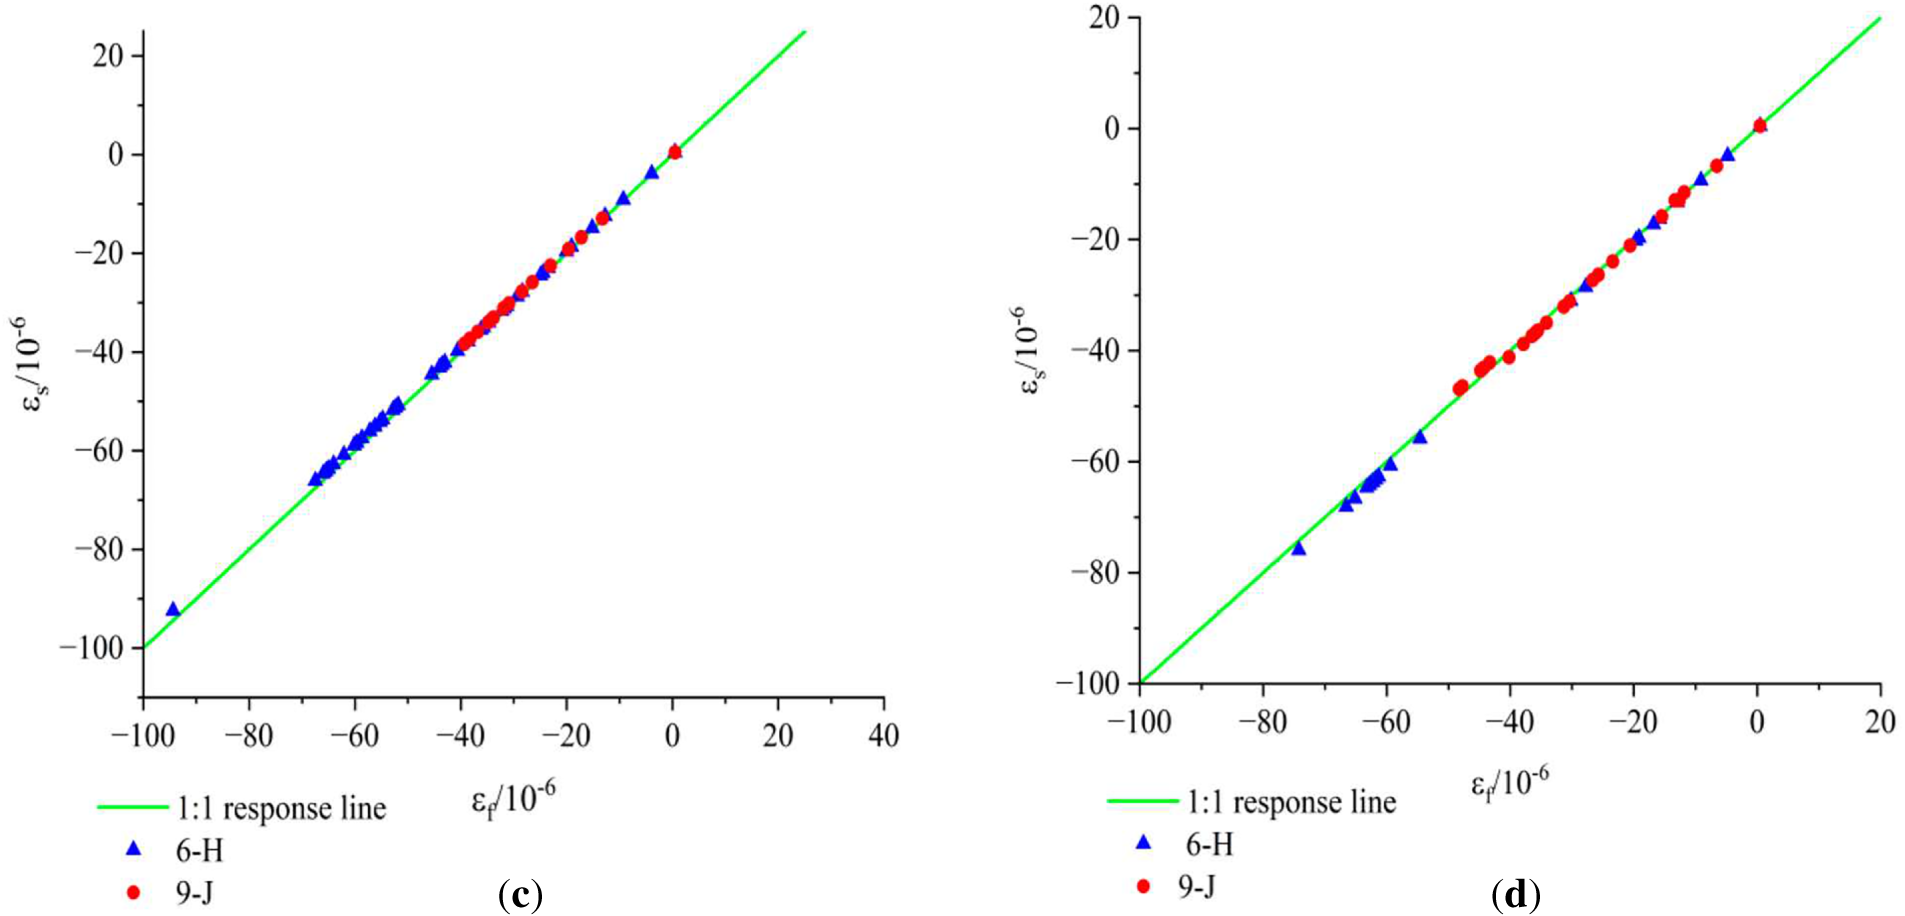
Figure 11. Calibration curve of strain ratio in the right area; (a) x-direction strain of 2-I, 4-I; (b) y-direction strain of 2-I, 4-I; (c) x-direction strain of 6-H, 9-J; (d) y-direction strain of 6-H, 9-J
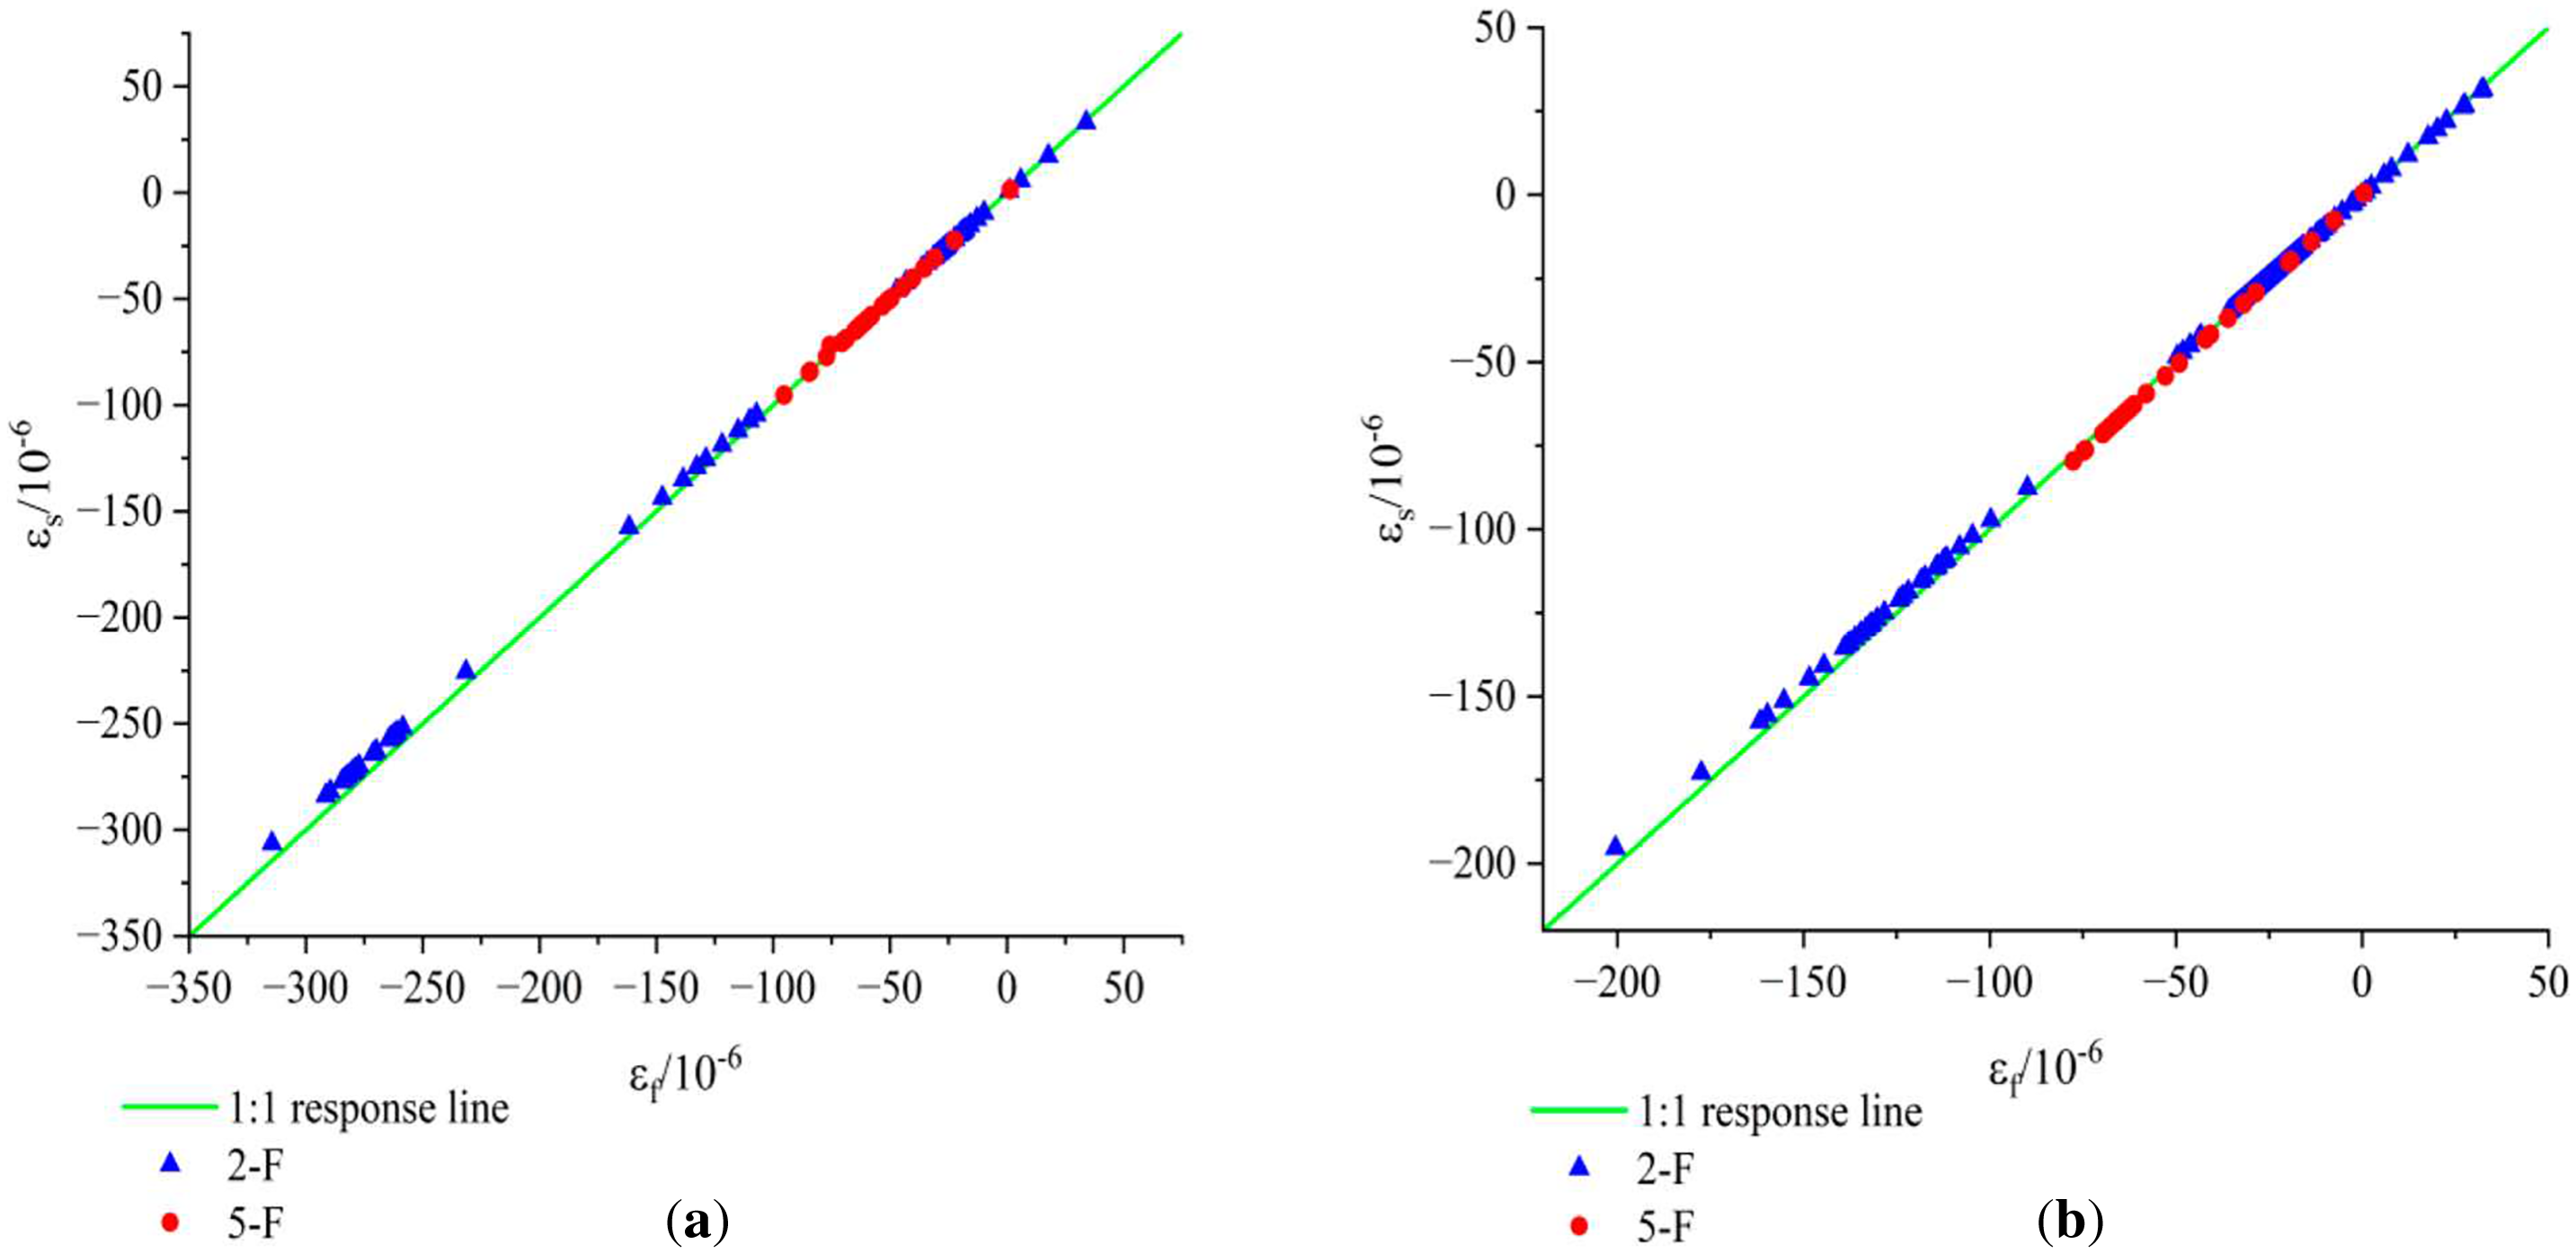
Figure 12. Calibration curve of strain ratio in the right area; (a) x-direction strain of 2-F, 5-F; (b) y-direction strain of 2-F, 5-F
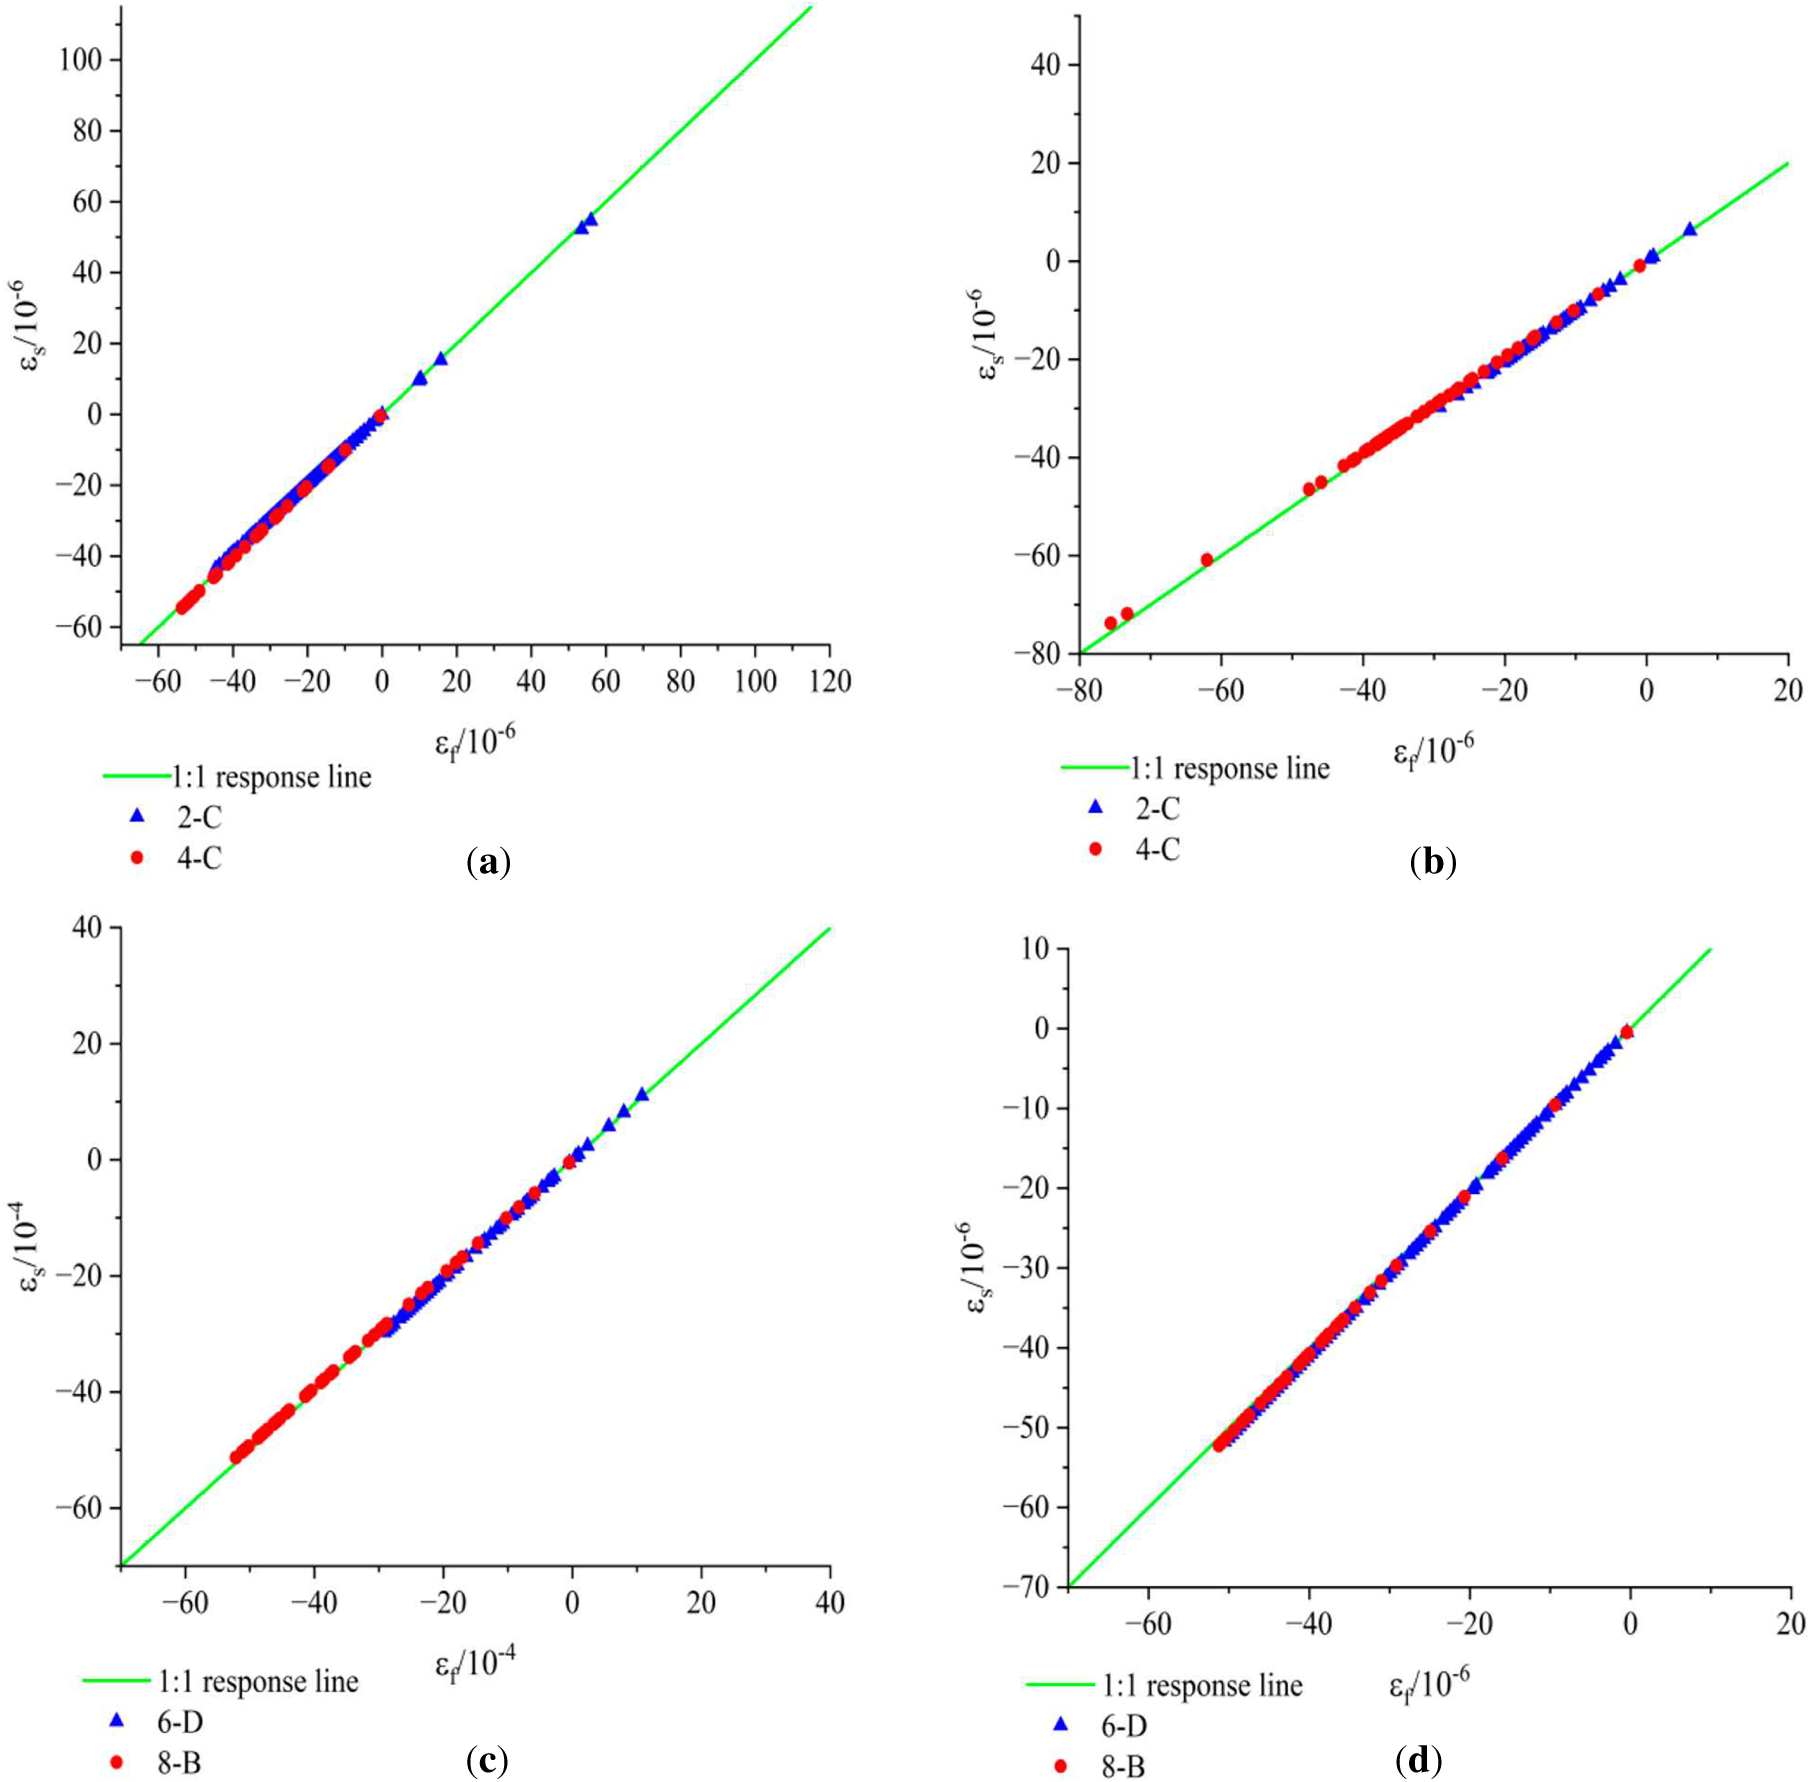
Figure 13. Calibration curve of strain ratio in the right area; (a) x-direction strain of 2-C, 4-C; (b) y-direction strain of 2-C, 4-C; (c) x-direction strain of 6-D, 8-B; (d) y-direction strain of 6-D, 8-B
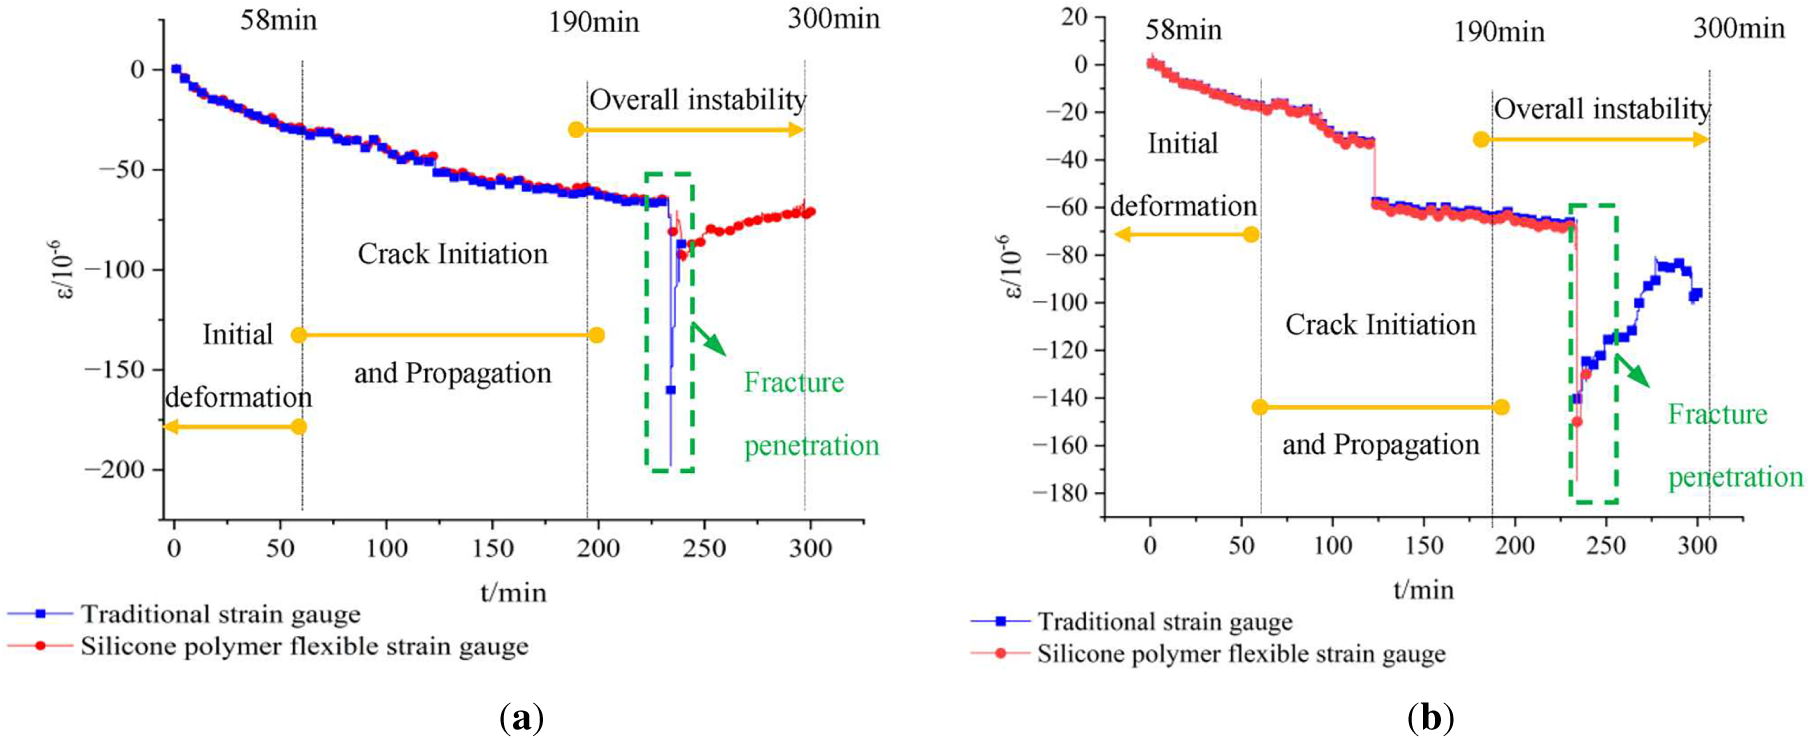
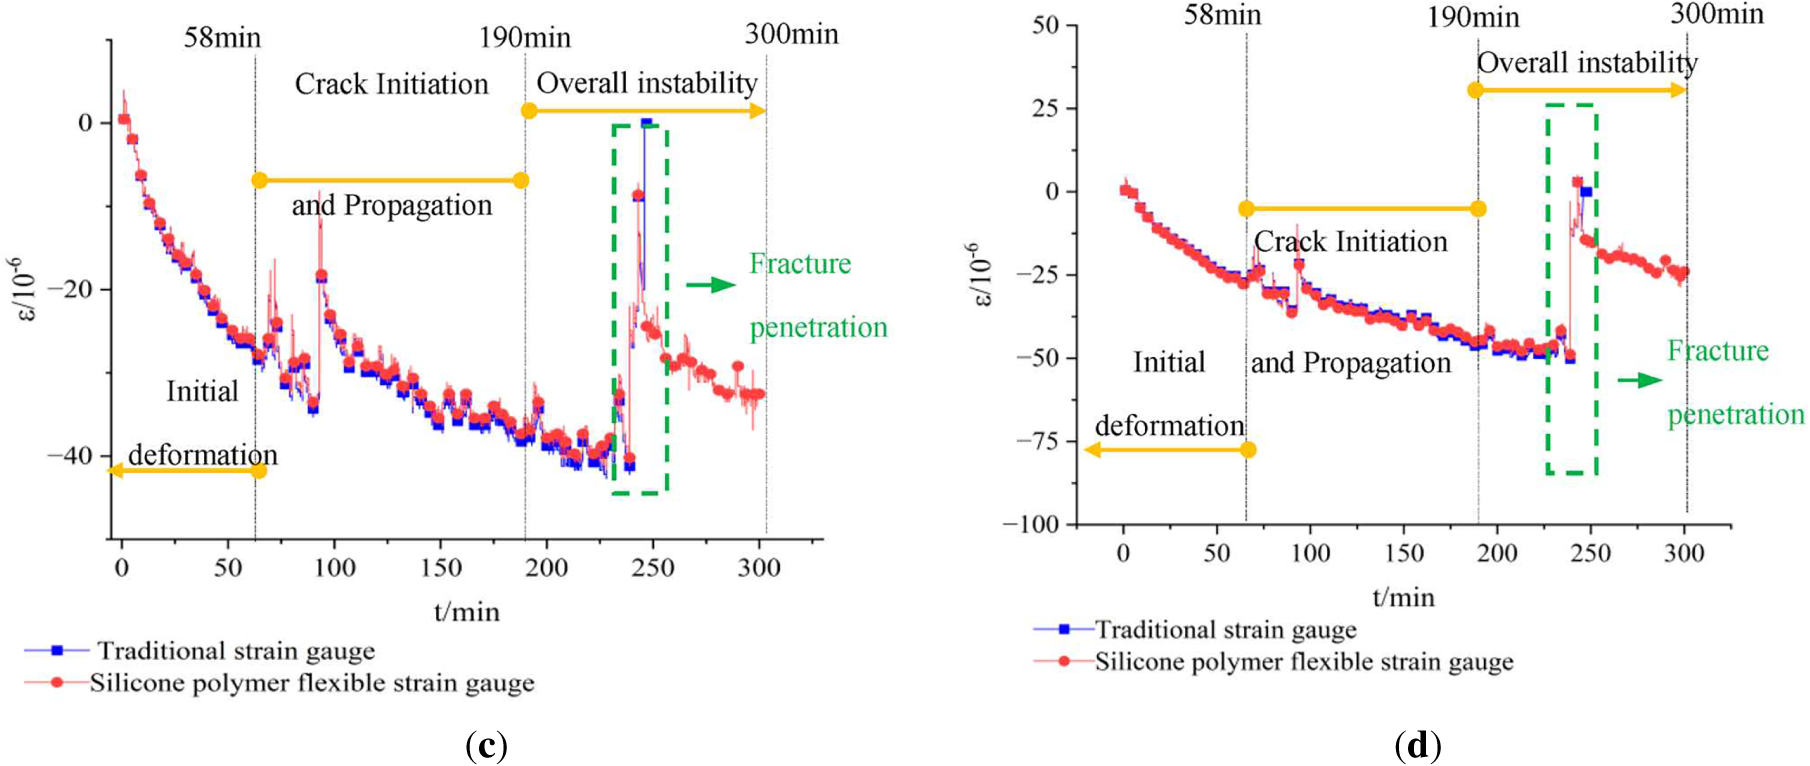
Figure 14. Comparison of strain at monitoring points; (a) x-direction strain of 6-H; (b) y-direction strain of 6-H; (c) x-direction strain of 9-J; (d) y-direction strain of 9-J
4.4. Comparative analysis of surface damage characteristics and strain monitoring response
A comparative analysis is conducted between deformation and failure characteristics of overlying strata and slope surfaces described in Section 4.1 and characteristics of strain changes in overlying strata and slope described in Section 4.2, so as to verify the monitoring reliability of the silicone polymer flexible strain gauges adopted in this experiment.
When applied to physical models of brittle similar materials, some traditional rigid strain gauges suffer fracture failure as macroscopic fractures propagate through their positions, leading to interruption of monitoring signals and making it impossible to capture the mechanical information of fracture propagation, a critical stage of instability. The silicone polymer flexible strain gauge effectively improves rigid-flexible interface compatibility and enhances signal continuity during the fracture development stage. In this physical model experiment, the stage characteristics of surface damage of the model are consistent and complementary to the internal strain response. The specific manifestations are as follows.
(1) Simultaneous initiation of cracks and sudden strain changes
When Coal Seam 1 was excavated for the fourth time, the overlying strata first showed tension cracks L1 (Figure 6b), and the x-direction strain of monitoring point 2-I located within its influence range changed from compression to tension, with violent fluctuations. This phenomenon originates from the rigid-flexible interface adaptability of silicone strain gauges. The modulus of their low-modulus encapsulation layer is far lower than that of the brittle strata in the physical model (fine sandstone, sandy mudstone and coal seam), which effectively reduces the local constraint strengthening inside the brittle rock mass, allowing strain gauges to sensitively capture the critical signal of rock mass transition from continuous deformation to discontinuous fracture.
(2) Correspondence between fracture propagation and continuous strain evolution
During the seventh to ninth excavation of Coal Seam 1, shear fractures L2 and L3 were formed near the foot of the slope (Figure 6e,6g). The strain curves of monitoring points located on the crack propagation path (such as the right slope foot 6-H and the left slope foot 6-D) did not fail to zero due to the penetration of the crack, but instead monitored the phenomena of tension compression alternation, stress release, and peak fluctuation corresponding to the gradual expansion process of the crack (Figures 8d and 10c). For instance, the y-direction compressive strain of monitoring point 6-H suddenly increases from −30.18 × 10⁻⁶ to −58.09 × 10⁻⁶ before and after the formation of shear fracture L2, and keeps varying in subsequent excavations, which is consistent with the gradual cracking trend of L2. This confirms that silicone polymer, with its flexible properties, acts as a “strain bridge” at the macroscopic crack interface, reflecting its fracture-bridging capability.
(3) The overall instability is consistent with the trend of strain response
During the overall instability stage, interconnected shear cracks are generated on the slope shoulder and fracture surface (Figure 7f,7g), and the strain curves of the corresponding monitoring points (such as 9-J, 8-B) show a complex response of irreversible tension compression alternation (Figures 8e and 10e). This phenomenon reflects rock mass sliding and embodies the inherent viscoelastic mechanical behavior of silicone materials. Benefiting from the viscoelastic characteristics of silicone polymer molecular chains, the strain gauges absorb energy and buffer impacts through internal molecular chain rearrangement during overlying strata collapse. This avoids instantaneous overload failure of strain gauges, and guarantees continuous and complete monitoring data in the intense movement stage of overlying strata.
Based on the characteristics of deformation and failure of the overlying strata and slope observed in physical model experiments, as well as strain monitoring data, a mechanical analysis of the instability mechanism of the rock mass under mining influence is conducted in combination with rock mechanics theory. Mechanical analysis is performed on three typical areas: the right area, the middle, and the left area, each with a unit width, to establish a rock structure mechanics model.
(1) Mechanical mechanisms of the slopes in the right and left areas
To facilitate a more effective mechanical analysis, the right-side slope with a unit width is taken as the research object, and a mechanical model of the right-side slope with unit width is established, as shown in Figure 15a, where l1 is the length of the slope with unit width and h1 is the height of the slope with unit width. For the analysis of the mechanical model of the right slope, the forces in the horizontal direction include the horizontal compressive FH1 and the horizontal shear resistance Fs1. When FH1 > Fs1, the horizontal stratum in the slope will slide; the vertical forces include the weight of the rock mass W1 and the vertical additional load Nb1 transmitted by overlying strata, with total vertical load being FV1. FV1 and Fs1 are explained as follows:
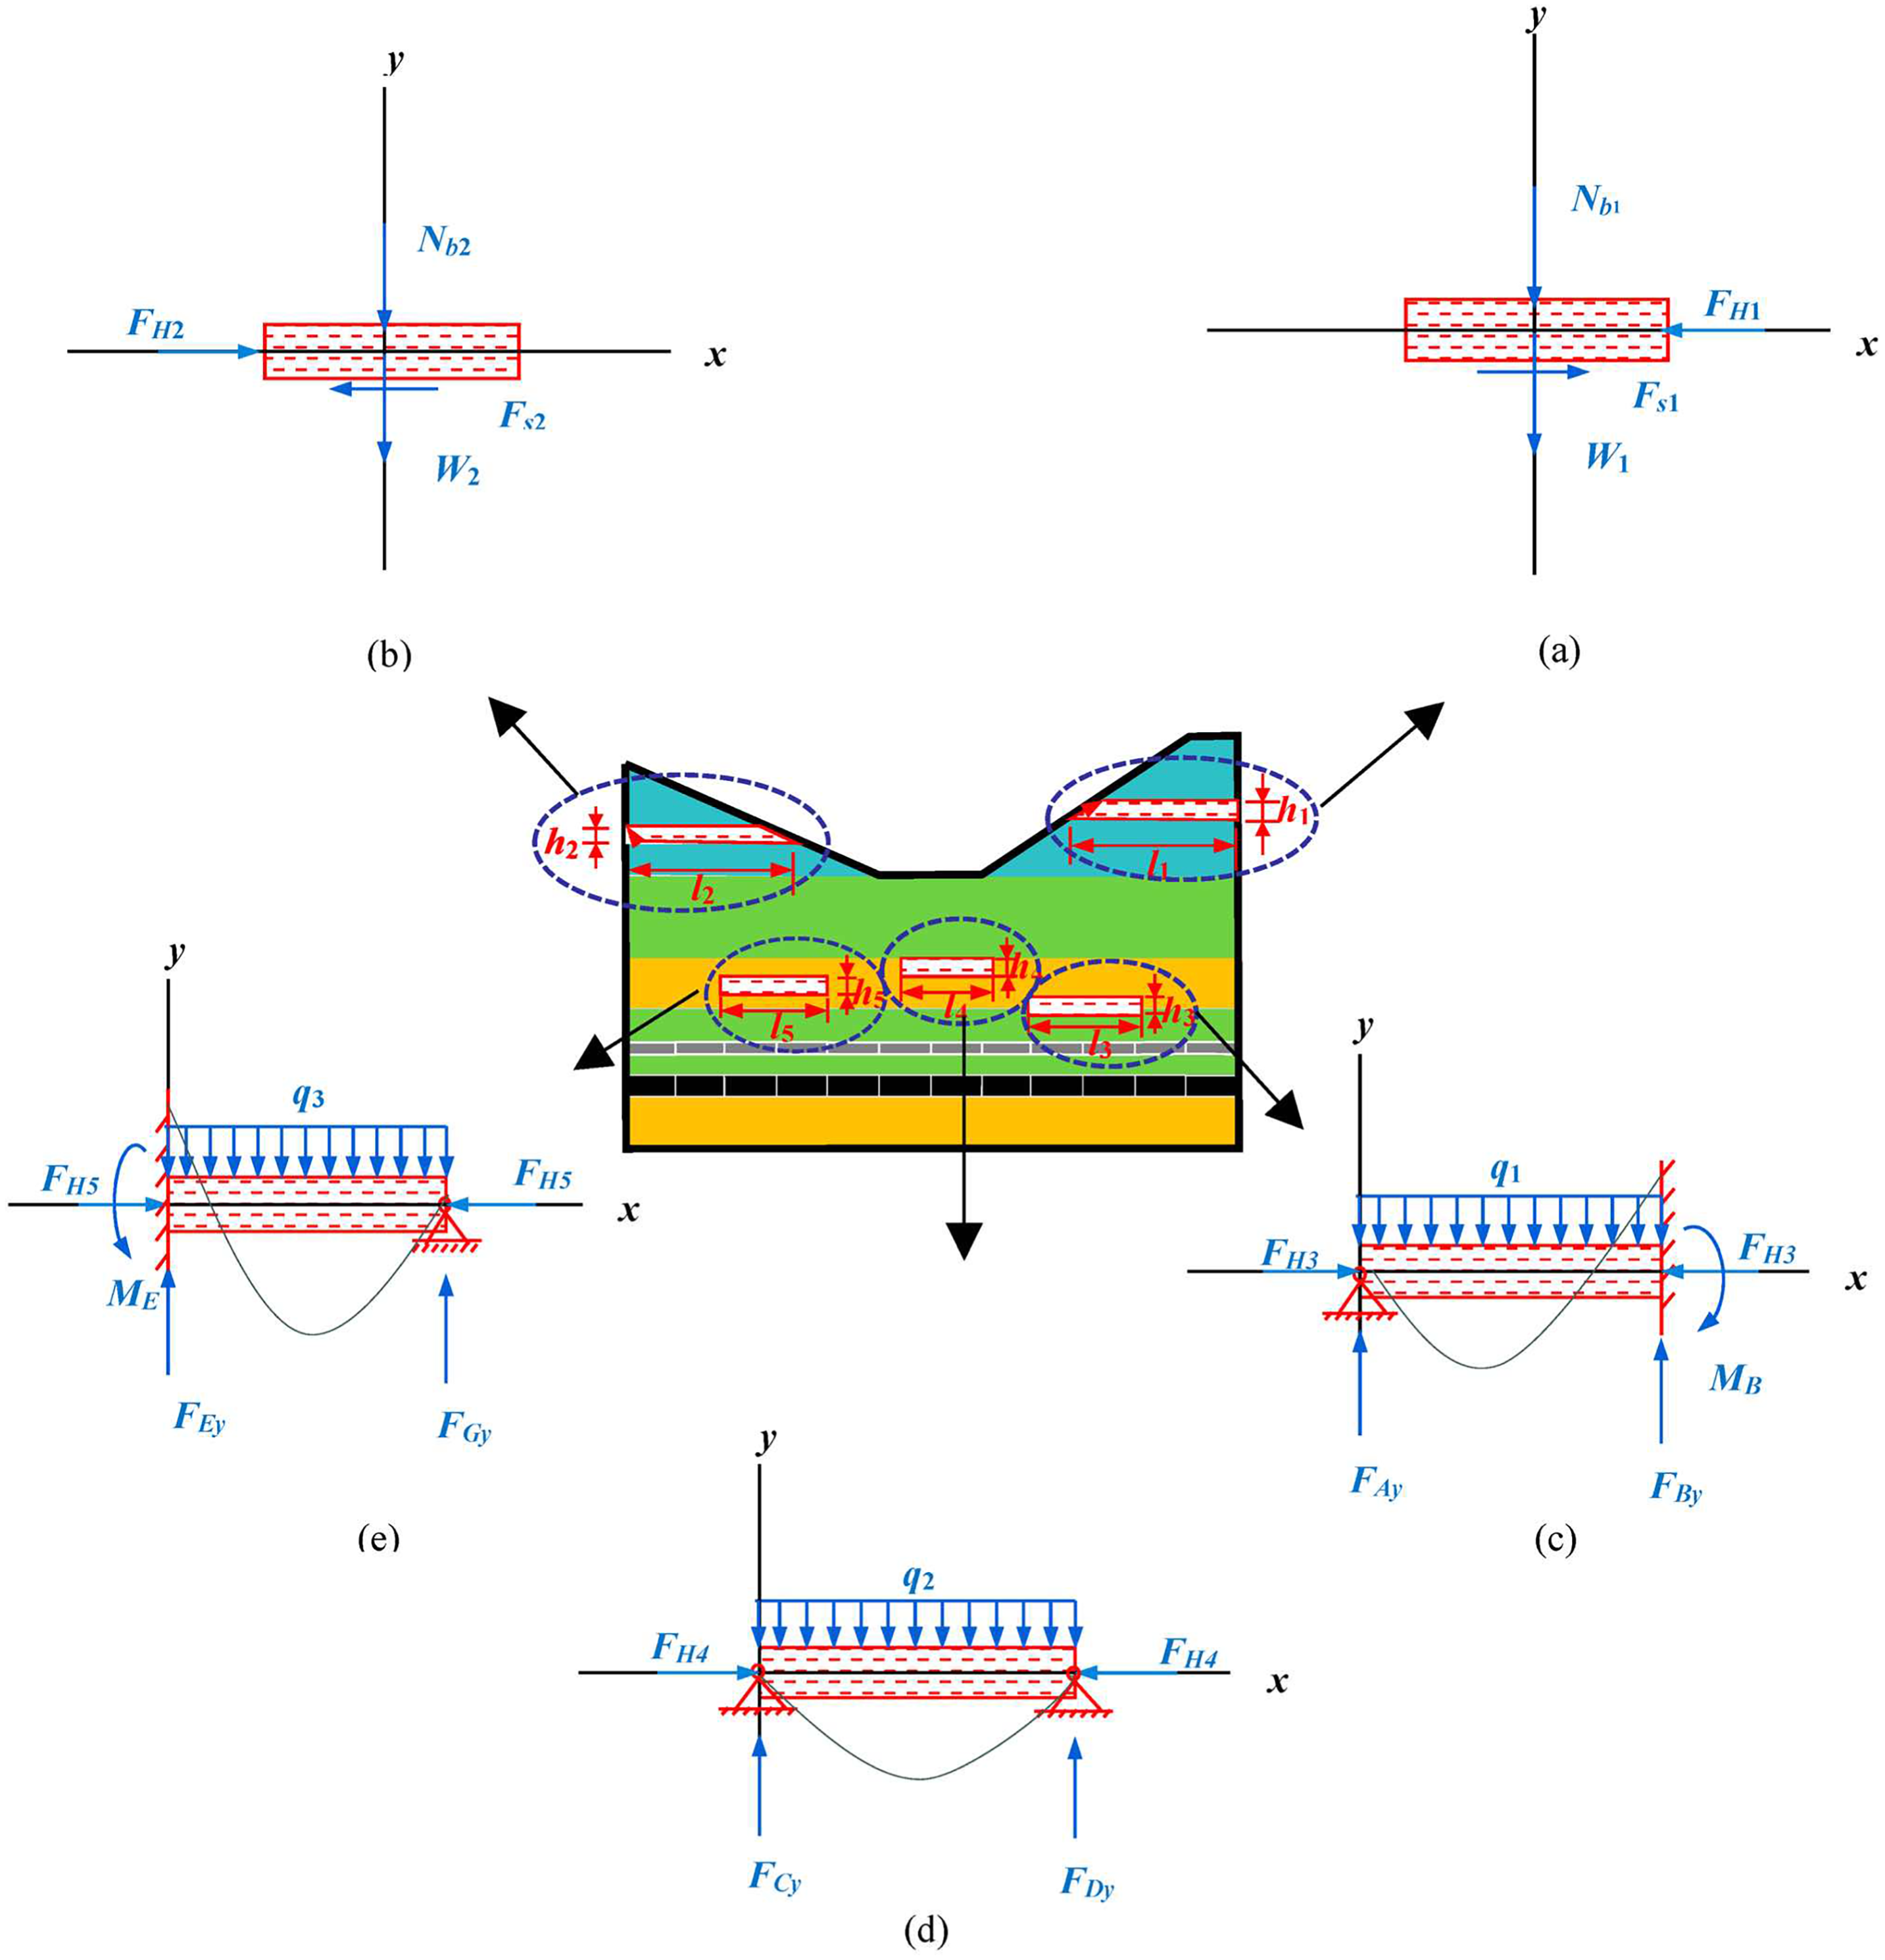
Figure 15. Mechanical model of a physical model; (a) Right-side slope mechanical model; (b) Left-side slope mechanical model; (c) Mechanical model of the overlying strata in the right area; (d) Mechanical model of the overlying strata in the middle area; (e) Mechanical model of the overlying strata in the left area
According to the limit equilibrium theory, the ranti-sliding force Fr1 and the sliding force Fd1 are respectively:
Slope stability factor k1 is:
where c is the cohesion and φ is the internal friction angle, both of which are mechanical parameters of the similar materials measured from standard specimens (as listed in Table 1). The potential sliding surface of the right-side slope is primarily controlled by the sandy soil layer. Therefore, the corresponding parameters of this layer are adopted, namely c = 11.2 kPa and φ = 28.7°.
At the initial stage of excavation, the monitoring points on the slope in the right area (such as slope surface 8-I, 9-J, 10-K) exhibited a slow increase in compressive strain in both the x and y directions. The internal horizontal compressive force FH1 of the rock mass increased, as did the vertical load FV1, and the rock mass was in an elastic adjustment phase. Although the stability factor k1 decreased slightly, it remained greater than 1. When Coal Seam 1 was excavated for the sixth and seventh times, the compressive strain fluctuated sharply and reached its peak (such as the monitoring point 6-H near the slope toe), reflecting a sharp increase in vertical load and intense compression of the rock mass. The x-direction compressive strain of the monitoring point 9-J near the slope surface had exhibited significant fluctuations. These severe compressive strain responses confirm the significant increase in horizontal pressure FH1 and vertical load FV1. The shear stress inside the rock mass increased rapidly.
When the shear stress exceeds the shear strength of the rock mass
Shear fractures occurred near the toe of the slope where stress concentration was most significant. This observation aligns with the shear fracture L2, oriented at approximately 50° to the slope surface, which was observed experimentally during the seventh excavation step. As the excavation progresses, the horizontal compressive force FH1 continues to increase. The continuous damage to the rock mass leads to the deterioration of cohesion c and internal friction angle φ, resulting in a slow increase or even decrease in the anti-sliding force Fr1. Ultimately, the stability factor k1 drops below 1, causing the potential sliding mass to undergo shear sliding along the horizontal bedding. Therefore, the instability of the right-side slope is driven by both horizontal extrusion pressure and vertical load, interacting with the degradation of rock mass strength to cause a pressure-shear composite failure.
Figure 15b is a schematic diagram of the mechanical model of a left-side slope physical model with unit width, where l2 is the length of the slope with unit width, and h2 is the height of the slope with unit width. The horizontal forces include the horizontal compressive force FH2 and the horizontal shear resistance Fs2; the vertical forces include the self-weight of the rock mass W2 and the vertical additional load Nb2 transmitted by the overlying strata. The total vertical load is FV2, that is . The failure mode of this slope remains shear sliding, where the sliding force Fd2 is the horizontal compressive force FH2, and the anti-sliding force Fr2 is the horizontal shear resistance Fs2. The analysis is as follows:
Slope stability factor k2 is:
where c represents cohesion and φ represents the internal friction angle. The values are adopted in the same manner as for the right-side slope, both derived from standard specimen tests of the similar materials (as listed in Table 1), that is, c = 11.2 kPa and φ = 28.7°.
Compared to the right side slope, the horizontal compressive force FH2 is smaller. The rock mass in this area has undergone overall damage and weakening due to mining activities, while FV2 increases due to the settlement of the overlying strata. As excavation progressed, the increase in horizontal compressive force FH2 increases the sliding force Fd2. The combined effects of rock strength deterioration and increased vertical load FV2 restrict the improvement of the anti-sliding force Fr2, causing the stability factor k2 to decrease below the critical point and triggering shear sliding. Monitoring points 9-A, 6-D, and others generally exhibited compressive strain, reflecting the combined effects of the horizontal compressive force FH2 and the vertical load FV2. Local tensile strain fluctuations (such as point 8-B) occurred during the critical instability stage due to internal structural adjustments of the potential sliding mass before the overall sliding, resulting in local tension phenomena. The dominant failure modes are still compressive strain and shear sliding.
(2) Mechanical mechanisms of overlying strata in the right, middle, and left areas
The “voussoir beam” theory, which serves as a theoretical framework for investigating the deformation and failure of overlying strata, conceptualizes the fractured rock layers as a beam-like structure composed of multiple rock blocks compressed together by horizontal squeezing forces [33,34]. Given its practical significance in engineering guidance, the overlying strata in each zone are accordingly simplified as rock beams for mechanical analysis.
Taking the overlying strata of unit width in the right area as the research object. Since the overlying strata in the middle area still retain certain load-bearing capacity at the initial excavation stage, they can provide vertical support for the overburden strata in the right zone. Horizontal compressive forces and frictional forces exist between the rock blocks formed after rock beam fracture, which can transfer a certain amount of horizontal load. As excavation progresses, the support stiffness at the left end decreases gradually, and the rock beam evolves towards a state with a moving boundary and instability-induced caving. Accordingly, it is simplified as a beam model with a fixed right end and a simply supported left end for analysis. The span of the beam is l3, and the height is h3. Figure 15c shows the mechanical model of the unit-width overlying strata in the right area. At the right end of the beam, there is a vertical support force FBy, a horizontal restraining force FH3, and a bending moment MB; at the left end, there is a vertical support force FAy and a horizontal restraint force FH3; the beam is subjected to a uniformly distributed load q1. Among them, FH3 represents the horizontal compressive force from both sides of the overlying strata, and q1 is the uniformly distributed load equivalent to the self-weight W3 of the overlying strata and the vertical additional load Nb3 transmitted from the upper overlying strata.
Under the vertical load q1, the beam model undergoes bending deformation. The maximum negative bending moment occurs in the right side of the rock beam, where the upper surface experiences tension due to the fixed-end moment MB; the mid-span rock beam generates the maximum positive bending moment, with the lower surface of the rock beam experiencing tension. During the initial stage of excavation, the fixed-end moment MB induces a horizontal tensile force FT1 on the upper surface at the right end of the rock beam, bringing the rock into a tensile state. When Coal Seam 1 was excavated for the fourth stage, the vertical support force FAy at the left end decreased due to the loosening of the overlying rock strata, and the mid-span bending moment increased. When the horizontal tensile force FT2 generated by the mid-span bending moment exceeded the tensile strength of the rock mass, the lower part of the rock beam was fractured, forming the tensile crack L1 observed in the experiment. The peak tensile strain in the x-direction at monitoring point 2-I coincided with the appearance of tensile crack L1, confirming that the lower surface of the rock beam was in tension. As excavation progresses, the span of the goaf increases, leading to a larger beam span and intensified bending. The rock beam fractures at the location of the maximum bending moment, eventually causing collapse, which is a typical bending-induced tensile failure.
The overlying strata in the middle area, as a key part above the goaf, plays a controlling role in overall stability. Figure 15d shows the mechanical model of the unit-width overlying strata in the middle area, simplified as a beam model simply supported at both ends, with a span of l4 and a height. There is a vertical support force FDy and a horizontal restraining force FH4 at the right end of the beam model; the left end experiences a vertical support force FCy and a horizontal restraining force FH4; the rock beam is subjected to a uniformly distributed load q2. Among them, FH4 represents the horizontal compressive force acting on both sides of the overlying strata, and q2 is the uniformly distributed load equivalent to the self-weight W4 of the overlying strata and the vertical additional load Nb4 transmitted from the upper overlying strata.
At the initial stage of excavation in Coal Seam 1, monitoring points 2-E, 2-F, and 2-G exhibited slowly increasing compressive strain in both x- and y-directions, indicating that rock beam underwent settlement under the action of the vertically uniformly distributed load q2. As excavation progressed, the goaf expanded, the vertical support forces FCy and FDy decreased, failing to effectively balance the vertical load, causing the beam model to bend and settle under the vertical load q2. The horizontal restraining force FH4 at both ends of the overlying rock beam placed the beam in an axially compressed state. In the initial settlement phase, the deflection of the rock beam was small, so the rock beam exhibited overall subsidence without immediate fracture. As settlement continued to develop, the axial compressive force aggravated the bending deformation of the rock beam. When the settlement reached a certain level, the horizontal restraining force FH4 coupled with the vertical load q2, leading to compressive-bending instability of the rock beam. Because the bending moment was greatest at mid-span, the rock beam was crushed in the middle area, resulting in multiple collapse events. The damage in the middle area is not simply a matter of bending or breaking, but rather a compressive-bending failure caused by the combined effects of horizontal compressive forces and vertical settlement.
The overlying strata in the left area with a unit width is taken as the research object and is simplified into a beam model fixed at the left end and simply supported at the right end for analysis. The span of the unit-width beam is l5, and the height is h5. Figure 15e shows the mechanical model of the overlying strata in the left area. At the left end of the beam model, there is a vertical support force FEy, a horizontal constraint force FH5, and a fixed end bending moment ME; there is a vertical support force FGy and a horizontal constraint force FH5 at the right end. The beam body bears a uniformly distributed load q3. Among them, FH5 represents the horizontal pressure acting on both sides of the overlying strata, and q3 is the uniformly distributed load equivalent to the self-weight W5 of the overlying strata and the vertical additional load Nb5 transmitted from the upper overlying strata.
At the initial stage of Coal Seam 1 excavation, the overlying strata in the left area were far from the excavation area, and the stress was relatively stable. Monitoring points 2-C, 4-C, 6-D, and 6-B exhibited stable compressive strain in the x- and y-directions. At this stage, the rock beam was in an elastic support state, with a relatively uniform bending moment distribution, and the horizontal restraining force FH5 and the vertical support forces FEy and FGy could balance the vertical load. When Coal Seam 1 was excavated in the later stage, the vertical support force FGy at the bottom of the right end of the rock beam weakened and the settlement of the beam under the vertical load q3 intensified, the bending moment of the rock beam redistributed, the fixed-end moment ME decreased, and the rock beam underwent rebound deformation. The decrease in compressive strain at monitoring point 2-C in both x and y directions was a mechanical reflection of unloading rebound. The formation of the shear fracture L3 at the toe of the left slope was the result of the combined deformation between the left overlying strata and the left slope. As the rock beam rotated and settled downward to the right, bending tension occurred, while simultaneously exerting a traction effect on the upper slope rock mass toward the goaf, leading to shear stress concentration in the slope toe area. After entering the excavation stage of Coal Seam 2, the settlement of the overlying strata in the left area became more severe, the support force FGy at the right end of the rock beam nearly disappeared, and the mid-span bending moment increased. When Coal Seam 2 was excavated for the sixth time, monitoring point 6-B exhibited a peak tensile stress in the x-direction, indicating that the lower surface of the middle part of the beam was under tensile stress due to bending, locally entering a tensile plastic state. Monitoring point 6-D, located in the overlying strata near the slope toe, reflects tensile action in the overlying strata at the slope toe under the traction of the potential sliding mass of the slope. Overall, this area exhibits bending-shear composite failure dominated by unloading rebound.
(1) The silicone polymer strain gauges enable continuous strain monitoring of the physical model throughout the entire process from initial deformation, fracture initiation and propagation to overall instability. Based on the characteristics of surface deformation and failure of the overlying strata and slope, as well as the abrupt change patterns of strain time histories, the excavation process is divided into three stages: the initial deformation stage (approximately 0–58 min), the fracture initiation and propagation stage (approximately 58–190 min), and the overall instability stage (after approximately 190 min).
(2) The material properties of the silicone polymer flexible strain gauges make them suitable for whole-process monitoring of brittle similar materials. Through in-situ comparative calibration within the same model, the sensitivity coefficient deviation after encapsulation is −2%, which falls within the allowable error range of 5% for geotechnical engineering physical model tests. The flexible strain gauges encapsulated with silicone polymer effectively reduce the local constraint effect of traditional rigid strain gauges on brittle similar materials by virtue of its rigid-flexible interface compatibility. Their can still perform continuous strain monitoring via its fracture bridging capability after fracture propagation and penetration. The silicone polymer flexible strain gauges realize whole-process continuous strain monitoring of brittle similar material models from initial deformation, fracture initiation and propagation to overall instability, and clearly capture the differences in mechanical responses of rock masses in different areas. The right area is affected by mining activities first, with fluctuations in compressive strain and alternating tension and compression, reflecting a cyclic process of “bending-fracturing-stress release” in the overlying strata; the middle area, as a key part of the overburden strata in the mined-out area, experiences multiple abrupt changes in strain, with the overlying strata undergoing bending-compression and crushing damage under the combined effect of horizontal compression and vertical settlement; the left area exhibits a lag in strain response, with tensile stress peaks and intense strain variations occurring in the later stages of mining, reflecting characteristics of unloading rebound and local tension.
(3) Through a comparative analysis between deformation and failure characteristics of overlying strata and slope surfaces and their characteristics of strain changes, the abrupt variations in the strain curves of the silicone polymer flexible strain gauges show favorable correspondence with key failure events such as tensile crack initiation, shear crack propagation and overburden caving. In particular, in areas where traditional strain gauges fail due to fracture penetration, the silicone polymer flexible strain gauges can still continuously output strain signals related to the crack evolution process, fully demonstrating their unique advantages in monitoring the discontinuous deformation and failure process of rock masses.
(4) Based on the theory of rock mechanics, typical mechanical models are established for the right, middle, and left areas. For the right and left slopes, analysis based on the limit equilibrium theory shows that both slopes exhibit a combined compression-shear failure, with their stability factors gradually decreasing below the critical value as excavation progresses, forming potential sliding masses. The overlying strata in each area are analyzed based on the “voussoir beam” theory, revealing the failure mechanisms in different areas. The overlying strata in the right area mainly exhibit bending-tension failure. In the middle area, the overlying strata undergo compression-bending failure under the combined effects of horizontal constraints and vertical loads. In the left area, the overlying strata exhibit bending-shear composite failure dominated by unloading rebound. The full-process continuous strain data of mining-induced overlying strata and slope instability acquired by the silicone polymer flexible strain gauges, as well as their monitoring capability of continuous output after fracture penetration in the physical model, serve as critical support for establishing a reliable correlation between mechanical models and experimental phenomena. In addition, the rigid-flexible interface compatibility and fracture-bridging capability of the silicone polymer flexible strain gauge are not limited to physical models of instability induced by underground coal mining; they can also be extended to other geotechnical physical model scenarios, such as tunnel excavation, surrounding rock deformation tests, and landslide evolution modeling. This provides a feasible solution for full-process deformation monitoring of various physical models constructed with brittle similar materials, demonstrating the broad application prospects of silicone polymer materials in the field of geotechnical engineering physical model monitoring.
(5) This study still has the following limitations. In terms of experimental operation, the sensing line damage at monitoring point 2-I in the right-side area is an accidental operational failure occurring during the experiment. Such operational risks can be further mitigated in subsequent experiments by optimizing the connection and fixation methods of the sensing lines. In terms of experimental conditions, the physical model does not consider multi-field coupling effects such as groundwater and gas; the long-term durability of silicone polymer in complex geological environments remains to be verified. In terms of engineering application, when extrapolating physical model test results to the field scale, attention should be paid to the joint constraints of the geometric similarity ratio and stress similarity ratio. Moreover, the heterogeneity and joint development degree of field rock masses are much higher than those of model materials, and the long-term bonding stability and signal drift of sensors still need to be verified by field tests. In the future, multi-field coupling tests and field monitoring tests should be carried out to further improve the monitoring technology and mechanical models, so as to provide more robust support for disaster prevention and control in coal mining areas.
Acknowledgement: Not applicable.
Funding Statement: This work was supported by Graduate Innovation Funding Project of North China Institute of Aerospace Engineering (YKY-2026-052 and YKY-2024-34).
Author Contributions: Study conception and design: Keyin Zhang, Dinggui Hou, Yunze Ma; data collection: Jin Hu, Jiahao Liang, and Xiaoyi Zhang; analysis and interpretation of results: Keyin Zhang, Dinggui Hou, Yunze Ma, Jin Hu; draft manuscript preparation: Keyin Zhang, Dinggui Hou, Yunze Ma. All authors reviewed and approved the final version of the manuscript.
Availability of Data and Materials: The data that support the findings of this study are available from the Corresponding Author, Dinggui Hou, upon reasonable request.
Ethics Approval: This study did not include human participants, human data, human tissue, or animal experiments. Therefore, ethical approval and informed consent were not required.
Conflicts of Interest: The authors declare no conflicts of interest.
How to Cite this Article
References
- Wang Q, Li R. Journey to burning half of global coal: trajectory and drivers of China’ s coal use. Renew Sustain Energy Rev. 2016;58:341–6. doi:10.1016/j.rser.2015.12.104. DOI
- Xie HP, Wu LX, Zheng DZ. Prediction on the energy consumption and coal demand of China in 2025. J China Coal Soc. 2019;44(7):1949–60. (In Chinese). doi:10.13225/j.cnki.jccs.2019.0585. DOI
- Ma S, Qiu J, Yang D, Wang J, Zhu Y, Tang B, et al. Surface multi-hazard effect of underground coal mining. Landslides. 2023;20(1):39–52. doi:10.1007/s10346-022-01961-0. DOI
- Zhu SN, Yin YP, Gao F, Yang CS, Zhang LM, Yang L, et al. Coal-mining induced rockmass landslide with layered fractured structure in Yangjiazhai, Wumeng Mountain area, China. Landslides. 2025;22(10):3475–91. doi:10.1007/s10346-025-02534-7. DOI
- Yin Y, Sun P, Zhang M, Li B. Mechanism on apparent dip sliding of oblique inclined bedding rockslide at Jiweishan, Chongqing, China. Landslides. 2011;8(1):49–65. doi:10.1007/s10346-010-0237-5. DOI
- Xiong S, Shi W, Wang Y, Zhu C, Yu X. Deformation and failure process of slope caused by underground mining: a case study of Pusa Collapse in Nayong County, Guizhou Province, China. Geofluids. 2022;2022:1592703. doi:10.1155/2022/1592703. DOI
- Lu L, Wang F, Luo YN, Liu MM, Liu HY. Deformation and instability mechanism of catastrophic landslide triggered by multiple coal seams repeated mining in peak cluster landforms. Bull Eng Geol Environ. 2026;85(5):32. doi:10.1007/s10064-026-04999-9. DOI
- Lv X, Zhou H, Wang Z, Cai Y. Movement and failure law of slope and overlying strata during underground mining. J Geophys Eng. 2018;15(4):1638–50. doi:10.1088/1742-2140/aab8b2. DOI
- Deng D, Wang H, Xie L, Wang Z, Song J. Experimental study on the interrelation of multiple mechanical parameters in overburden rock caving process during coal mining in longwall panel. Int J Coal Sci Technol. 2023;10:47. doi:10.1007/s40789-023-00608-2. DOI
- Li X, Yang S, Wang Y, Nie W, Liu Z. Macro-micro response characteristics of surrounding rock and overlying strata towards the transition from open-pit to underground mining. Geofluids. 2021;2021:5582218. doi:10.1155/2021/5582218. DOI
- Wang J, Liu F, Li Q, Yang S. Study on fracture characteristics of overburden structure and surface deformation law of shallow buried coal seam group mining. Comput Part Mech. 2026;16:334–46. doi:10.1016/j.cpms.2026.07.001. DOI
- Huo S, Tao Z, Liu K, Li Y, He M. Physical model of overlying rock movement law in Yuwang coal mine. J Mt Sci. 2024;21(12):4323–44. doi:10.1007/s11629-023-8369-y. DOI
- Nizametdinov F, Nizametdinov R, Akhmatnurov D, Zamaliyev N, Mussin R, Ganyukov N, et al. Geomechanical basis for assessing open-pit slope stability in high-altitude gold mining. Appl Sci. 2025;15(15):8372. doi:10.3390/app15158372. DOI
- Sun Y, Zuo J, Karakus M, Wen J. A novel method for predicting movement and damage of overburden caused by shallow coal mining. Rock Mech Rock Eng. 2020;53(4):1545–63. doi:10.1007/s00603-019-01988-1. DOI
- Bian H, Zhao Y, Zhao L, Wang Y, Yang H, Hao J, et al. Nonlinear regression analysis of overburden structure movement and damage features in deep thick coal seam mining: physical experiment and numerical simulation. Int J Coal Sci Technol. 2026;13(1):69. doi:10.1007/s40789-026-00910-9. DOI
- Liu Y, Yang T, Deng W, Liu H, Gao Y, Ma K, et al. Characteristics of overburden damage and rainfall-induced disaster mechanisms in shallowly buried coal seam mining: a case study in a Gully Region. Sustainability. 2024;16(17):7538. doi:10.3390/su16177538. DOI
- Liu J, Wang Y, Zuo J, Wu Z, Sun Y, Zheng Z. Asymmetric analogous Hyperbola model of overburden movement and its verification. Sci Rep. 2024;14:15614. doi:10.1038/s41598-024-66622-9. DOI
- Wang F, Wu Y, Jiang A, Wu K. Impact of underground near surface ore body mining on the stability of overburden and dangerous rock masses. J Meas Eng. 2025;13(3):722–35. doi:10.21595/jme.2025.24775. DOI
- Lu J, Jiang C, Jin Z, Wang W, Zhuang W, Yu H. Three-dimensional physical model experiment of mining-induced deformation and failure characteristics of roof and floor in deep underground coal seams. Process Saf Environ Prot. 2021;150:400–15. doi:10.1016/j.psep.2021.04.029. DOI
- Einstein H. Physical modelling in rock mechanics and rock engineering. Rock Mech Rock Eng. 2024;57:10187–204. doi:10.1007/s00603-024-04106-y. DOI
- Yoon J, Lee J, Kim G, Ryu S, Park J. Deep neural network-based structural health monitoring technique for real-time crack detection and localization using strain gauge sensors. Sci Rep. 2022;12(1):20204. doi:10.1038/s41598-022-24269-4. DOI
- Shah Mansouri T, Lubarsky G, Finlay D, McLaughlin J. Machine learning-based structural health monitoring technique for crack detection and localisation using bluetooth strain gauge sensor network. J Sens Actuator Netw. 2024;13(6):79. doi:10.3390/jsan13060079. DOI
- Boursier Niutta C, Tridello A, Ciardiello R, Paolino DS. Strain measurement with optic fibers for structural health monitoring of woven composites: comparison with strain gauges and digital image correlation measurements. Sensors. 2023;23(24):9794. doi:10.3390/s23249794. DOI
- Racek O, Balek J, Loche M, Vích D, Blahůt J. Rock surface strain in situ monitoring affected by temperature changes at the Požáry field lab (czechia). Sensors. 2023;23(4):2237. doi:10.3390/s23042237. DOI
- Jin Z, Li Y, Li Q, Liu Z, Wu S, Wang Z. Modification of the CSIRO method in the long-term monitoring of slope-induced stress. Front Earth Sci. 2022;10:981470. doi:10.3389/feart.2022.981470. DOI
- Zhao X, Li Y, Yun Z, Zhang W. Investigation on flight load calibration of aircraft composite wing base on strain gauge measurement. Theor Appl Mech Lett. 2024;14(5):100540. doi:10.1016/j.taml.2024.100540. DOI
- Yan J, Downey A, Cancelli A, Laflamme S, Chen A, Li J, et al. Concrete crack detection and monitoring using a capacitive dense sensor array. Sensors. 2019;19(8):1843. doi:10.3390/s19081843. DOI
- ZhaoY K L, Hu G, Zhang P, Ji Y. Physical similarity simulation of closely stacked coal seams mined in faulted geological environments: a comprehensive experimental investigation. Energy Sci Eng. 2024;13(1):290–308. doi:10.1002/ESE3.1997. DOI
- Kan Z, Dou L, He H, Kang J, Cai W, Ju M, et al. Advances and trends in multi-field coupling induced disaster similarity theory within deep ground engineering. Geomech Geophys Geo Energy Geo Resour. 2024;10:187. doi:10.1007/s40948-024-00905-3. DOI
- Wang HR, Zhao M, Zhong ZL, Zhang XY, Zhao X, Du XL. Similar materials for quasi-static scaled tests of fault-crossing tunnels. Eng Mech. 2022;39(6):21–30. (In Chinese). doi:10.6052/j.issn.1000-4750.2021.03.0168. DOI
- Gao L, Li Z, Li J, Wang Z, Jiang H, Wang M. Application of fiber grating sensing in similar model impact tests of underground engineering. Geofluids. 2023;2023:8185870. doi:10.1155/2023/8185870. DOI
- Chen JF, Ooi JY, Rotter JM. Local stiffening effect of ‘double deck’ bending strain gauges: part 1. Strain. 1996;32(1):13–22. doi:10.1111/j.1475-1305.1996.tb00987.x. DOI
- Qian MG, Miao XX, He FL. Analysis of key blocks in the voussoir beam structure of the stope. J China Coal Soc. 1994;6:557–63. doi:10.13225/j.cnki.jccs.1994.06.001. DOI
- Liu C, Li H, Mitri H, Jiang D, Li H, Feng J. Voussoir beam model for lower strong roof strata movement in longwall mining—case study. J Rock Mech Geotech Eng. 2017;9(6):1171–6. doi:10.1016/j.jrmge.2017.07.002. DOI